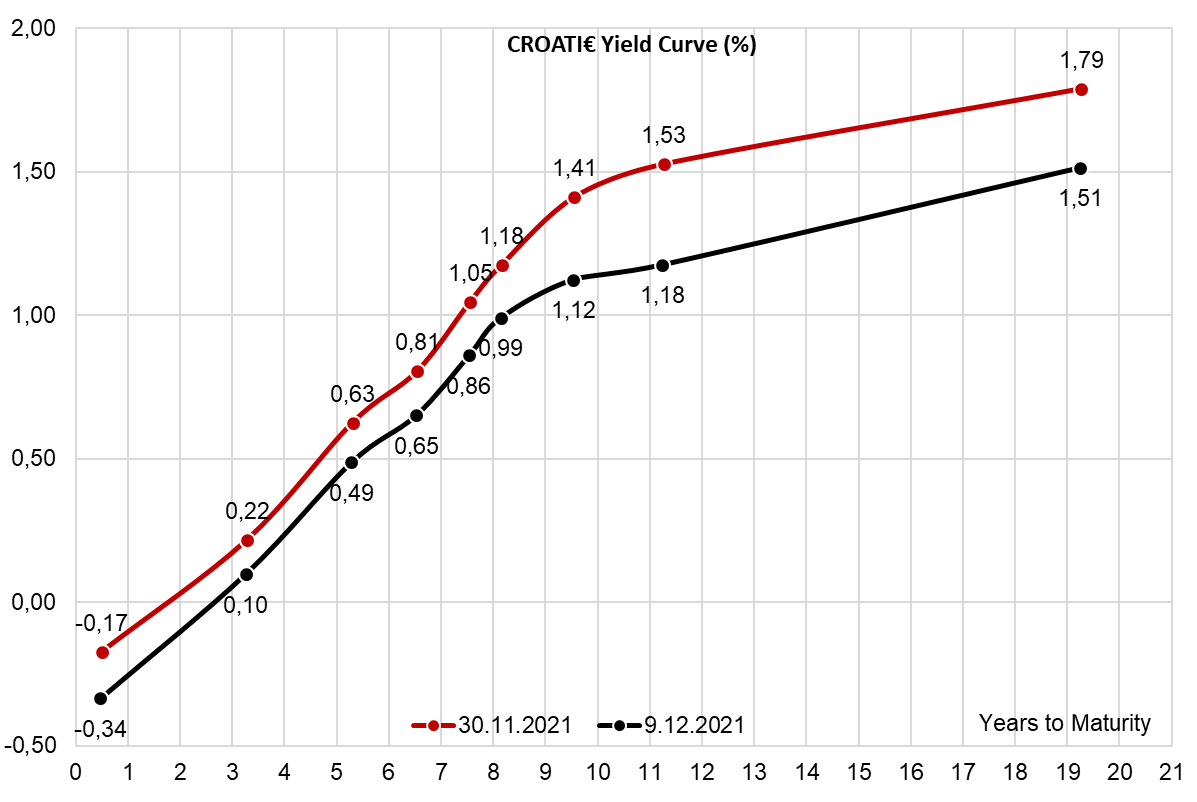
Bond investors went through another rollercoaster ride in recent weeks, first with Thanksgiving sell off (or Day of the Republic sell off, whichever you prefer), followed by an equally abrupt melt up around December 06th (St. Nicholas Day). If the melt up had happened a week or two later, we would have called it Santa Clause rally. What have we learned from the recent sell off about the CROATI spread hedging? Find out in this brief article.
What we have seen on international bond market at the end of November can certainly be dubbed „Thanksgiving sell off“. In part because the real offloading started around 25th November (US holiday), but mostly because in hindsight opportunistic CROATI and ROMANI buyers could say “Thanks!” to sellers “giving” away their positions around turn of the month. Looking ab ovo, it’s pretty clear that the emergence of omicron variant fostered a bidless EM sell off and dealers simply did not know what to do with all that inventory. That’s why on cyber Monday (Monday 29th, the former Day of the Republic in ex-Yugoslavia countries) the Street dealers started refusing any EM RFQ/ALLQ sell order, unless it came from a dedicated asset manager. LDIs don’t sell on these bouts of volatility – usually they fish for opportunities trying to figure out where the dip would be.
What’s the financial market connection between the omicron variant and CROATI/ROMANI sell off? We stick to the belief that outflows from EM ETFs, funds and portfolios in general might have kicked off the EOY offloading. Take a look at the EMB US Equity on Bloomberg (iShares J.P Morgan USD Emerging Markets Bond ETF), an ETF that lost 709mm USD (total AUM is about 19bn USD) through outflows alone in week ending November 26th. Although this fund owns only two outstanding CROATI$, we believe the outflow data could also be use to extrapolate the trend on other similar portfolios. EM accounts were selling and EMB US Equity was just the bellwether, but not necessarily the only one. We were also informed about FED hiking rates on a faster pace affecting EM outlook, but on the other hand omicron variant scare might have decreased that probability, or even cancelled it completely, due to the possibility of GDP growth slowing down. We don’t believe FED hikes fostered EM sell off. As a matter of fact, if you have nothing better to do today, take a look at EDZ2 Comdty: it increased from 98.935 to 99.115 between November 26th and November 30th, right about at the trough of fixed income off load. The price rise spells fear of financial markets that the FED won’t hike rates so fast and it’s also worth bearing in mind that when EM FI recovery took hold, EDZ2 dropped right back at 98.97:
There is one more valuable lesson that could be learned here. First of all, take a look at this quick correlation analysis between weekly percentage changes in price of CROATI 1.5 06/17/2031€ and EMB US Equity over a 2Y period:
The R2 is 0.428% and it’s really tough to bring this ratio up since we’re comparing USD ETF to CROATI€ price. The R2 for CROATI 1.5 06/17/2031€ and BTPS 0.95 12/01/2031€ is about 0.155%, for instance:
For the time being, let’s assume they’re correlated and that the EMB outflows drive CROATI 1.5 06/17/2031€ price drop. Now, run EMB US Equity OMON and notice that this fund has liquid options and 30D AM put is traded at 7.76% implied volatility (0.96-1.10 bid-ask). If you want to hedge CROATI spread through liquid instruments, EMB US Equity options should be in your toolbox.
If you did not hedge, that’s OK because the yields retraced most, if not all of the Thanksgiving sell off and currently we don’t see any opportunistic buyers. We’re looking at a couple of pretty boring weeks on foreign fixed income markets because most of real money accounts have started locking up accounts in preparation for the turn of the year. We would still be around if you need to buy or sell a bond.
Out of the 17 observed indices, SOFIX tops the list with a YTD increase of 38.45%.
The eleven months of 2021 could be considered as a very solid period for equities both in the region and globally. With the good performance of SOFIX and SBITOP, as well as CROBEX, we decided to take a look at how does this performance compares to major European and global indices. For this, we looked at 17 selected equity indices.
As visible from the graph, 15 out of 17 indices noted a double-digit increase while SOFIX and SBITOP lead the list with a YTD increase of 38.4% and 35.8%, respectively. Croatian CROBEX also noted a very solid increase of 14.6%, despite being heavily reliant on the tourism sector, which has been significantly affected since the outbreak of the pandemic. On the flip side, only 1 index (of the observed ones) to note a YTD decrease was Hang Seng, which noted a decrease of -9.68%.
YTD Performance of Selected Indices (%)
At the same time, looking at the performance of the indices in November, one can see a slightly different picture. Since the beginning of November, 9 out 17 indices experienced a decrease on the back of COVID-19 omicron variant news and the uncertainty it poses. The largest decrease was experienced by WIG20 and IBEX 35 indices, a decrease of 7.37% and 7.2%, respectively. On the flipside, SOFIX and BELEX15 both experienced a solid increase since the beginning of November, an increase of 6% and 4.7%, respectively.
Performance of Selected Indices since the beginning of November (%)