When our US counterparties try to tell us that somebody is “talking the talk, but not walking the walk“, they usually describe the person with the expression “all hat and no cattle”. It essentially describes the person who dresses up like a cowboy but has no cattle (hard assets) to substantiate his perceived identity. Well, this is exactly how the ECB’s Q&A looked like last Thursday – all hat (dovish lingo), but no cattle (results in terms of lower CPI prints). How are Croatian assets reacting to this – find out in this brief research piece.
With a benefit of hindsight, we could conclude that the recent ECB dovishness was quite short-lived, mostly thanks to hard data announced the following day. But let’s take it step by step.
ECB’s Governing Council raised interest rates by 75bps last Thursday, a move completely in line with market expectations. Apart from that more tightening came through the channel of TLTROs – during the pandemic the ECB initiated a 2.1tn EUR TLTRO instrument, allowing the euro area banks financing at 50bps below the deposit facility rate. It was essentially a cash giveaway since banks had the opportunity to borrow at 50bps below the deposit facility and then deposit the proceeds back at the central bank at the deposit facility rate, netting half a percentage point worth of income in the process. That loophole is closed because from November 23rd these loans would track the deposit facility rate. Salomon Fielder (Berenberg) called this “a rate increase through the back door” and ECB staff estimates that about 600bn EUR of loans might be returned in November. This would definitely ease the lack of collateral on front-end BTP/SPGB curves, so if you were looking to load up on short-term periphery EGBs, November might be your month for action.
But more on ECB. Although fast money accounts might have seen some dovishness in the Q&A session, smart money thought otherwise. The bulk of the dovishness mirage came from one sentence alone – “substantial progress” has been made on “withdrawing monetary accommodation”. Madame Lagarde never said that the ECB’s course of action has been creating the desired results in terms of bringing the core CPI down, although we all know that monetary policy works with a lag. ECB cheerleaders pointed out that EURUSD closer to parity might be playing a significant part in anchoring down inflation expectations (and in that way core CPI as well). Still, that’s all hat and no cattle. Also, pay close attention to the wording of the following statements: Lagarde mentioned that a recession might be “looming much more on the horizon” and that now the ECB is aiming for “reducing support for demand”. Recession expectations should definitely contribute to anchoring down the core CPI, however, you still have the food and energy component which might easily jump back up, especially if crude oil prices stage another rally following the US midterms and December OPEC+ meeting.
Why were the markets so hooked up on the dovish ECB mirage? You must also look at the playbook of other central banks. A week before the ECB GC meeting Fed’s James Bullard and Mary Daly started to let probe balloons on possible slower US rate hikes going forward. Then the ball started rolling – the Bank of Canada delivered a smaller-than-expected rate hike of 50bps and the loonie (USDCAD) hasn’t fallen apart ever since. That was a signal, but it turns out it was nothing more than a false dawn for central bank dovishness. ECB’s perceived dovishness was refuted on the following Friday once German, French, and Italian CPI figures came hotter than expected.
Madame Lagarde pointed out that the coming course of action remains data-dependent, so the wisest suggestion we can make right now is to focus on the short run, i. e. November bond flow. It’s quite likely that November’s return of TLTRO proceeds to the ECB, regardless of their size, might leave Lombard Street dealers with significant portions of periphery EGBs on their books. We’re not convinced that Italian asset managers’ demand might relieve the clout, at least not without meaningful spread widening on the front part of the BTP curve. This comes with a big caveat. After November 08th and the end of the US midterms, US risk markets usually stage a rally which is consistent with the tightening of HY premia and lo spread (BTP-Bund) tightening. We advise caution with this idea – we are under the impression that Apple makes up a significant portion of recent SPX’s good performance. Recent news about strict Covid policies in Zhengzhou, the bedrock of Foxconn’s manufacturing and assembly, might become a major headwind to Apple results in Q4 2022, in other words, the holiday season. All of this is a signal for caution, instead of a call to go all in.
Source: Bloomberg
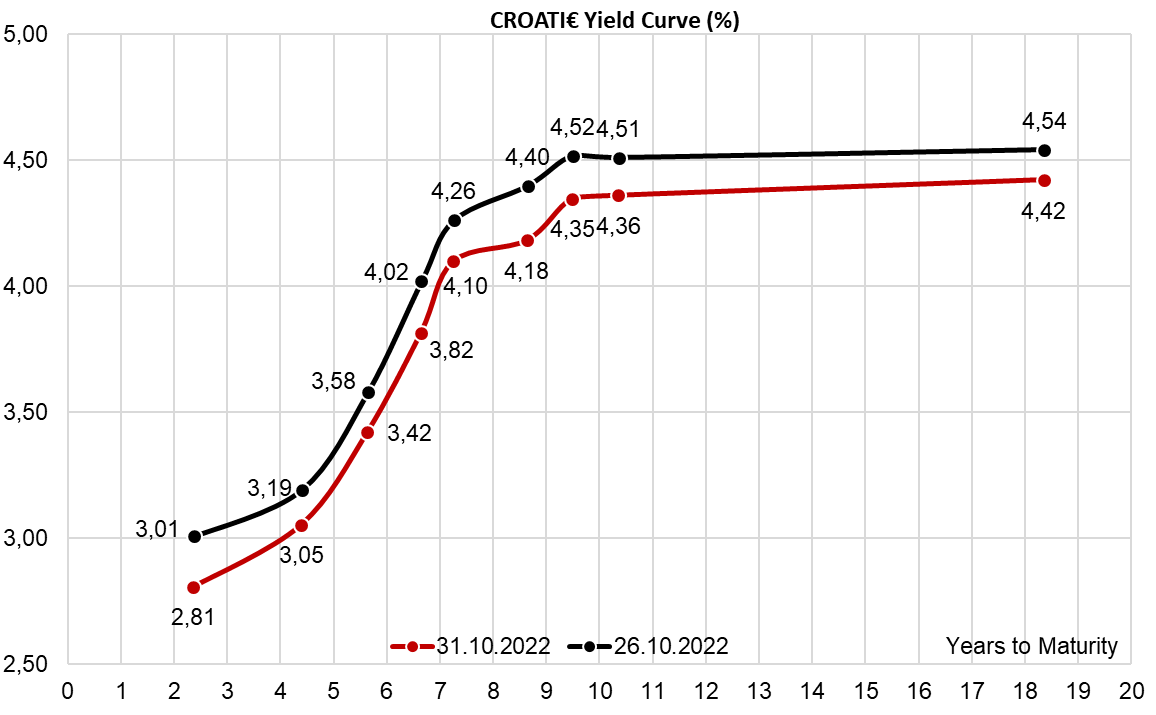
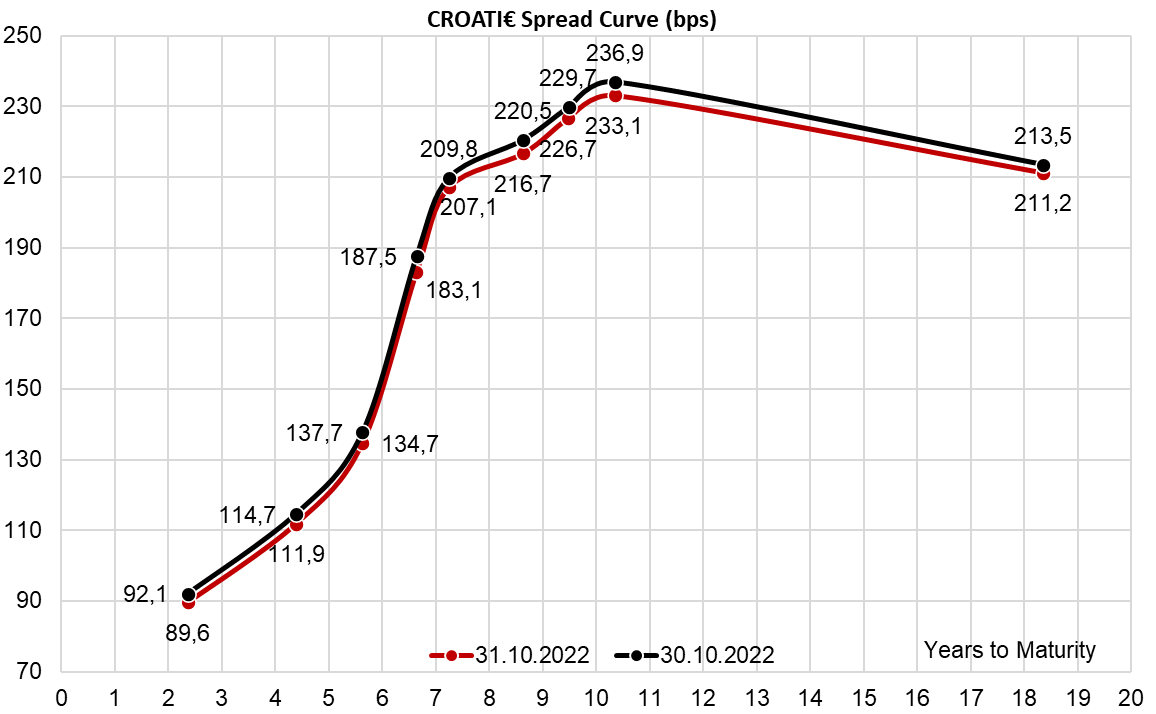
How did all of this affect CROATI€ curves? Well, the yields are slightly lower, however, the spreads are unchanged. To be honest, we have been seeing a lot of demand for longer CROATI€, but it mostly comes from regular, planned flows. Active managers and risk-takers haven’t yet started loading up on CROATI€, perhaps paralyzed by the lack of visibility on the trajectory of major central banks. Stay tuned for more.
Source: Bloomberg
In 9M 2022, sales revenue increased by 67.6% YoY, EBITDA increased by 93.5%, while net profit amounted to HRK 2.77bn, an increase of over 2.5x YoY.
INA has published its 9M 2022 results. According to the results, INA increased its sales revenue by 67.6% YoY in 9M 2022, amounting to HRK 27.23bn during the first nine months of the year. The main drivers of these continuous strong results were the high prices of Brent oil, with levels above 100 USD per barrel, and CEGH gas price exceeding even 200 EUR/MWh at some point in Q3 2022 due to an ongoing increased geopolitical risk, turmoil, and uncertainty in the safety of supply.
The “Exploration and Production” revenue grew by 109% from HRK 2.6bn in 9M 2021 to HRK 5.4bn in 9M 2022, making it the biggest contributor to the result. Higher prices impacted sales revenues positively by HRK 2.6bn. Increased gas prices added HRK 1.73bn, while 56% higher Brent price brought an additional HRK 718m crude oil and condensate sales revenues with other products positive impact on revenues in the amount of HRK 1,154m.
Croatian production has decreased because of natural declines of onshore oil fields, higher water cut on major gas fields, and natural declines in major gas condensate fields in Deep Podravina. International production has declined in Egypt as well, however, it has increased in Angola due to an increase of INA share on Block 3/05 by 1.3% due to exit of the partner.
The “Refining and Marketing, including Consumer Services and Retail” revenue grew by 68% from 15.86bn in 9M 2021 to 26.7bn in 9M 2022. Captive market sales have increased despite commercial margins being under pressure due to government price regulations on the domestic market. Refinery operations started at the end of March ensured stable captive market supply in the following months, mitigating the risk of lower product availability driven by the Russia-Ukraine crisis.
The Company’s EBITDA grew strongly by 93.5% YoY, amounting to HRK 4.53bn in 9M 2022. “Exploration and Production” segment’s EBITDA amounted to HRK 3.9bn, up 150% YoY. Because of mentioned growth, INA’s net profit increased strongly by 153.1% from HRK 1.1bn in 9M 2021 to HRK 2.8bn in 9M 2022.
When it comes to investments, CAPEX more than doubled compared to 9M 2021. Investment activities continue to be on high levels on “Refining and Marketing” to mitigate the trend of natural production decline. Rijeka Refinery Upgrade Project continues to be INA’s largest investment in history. “Exploration and Production” also increased CAPEX levels, focusing on development activities both onshore and offshore in Croatia and Egypt.
Due to strong investment activities and unprecedented financing need for the working capital due to the global energy price levels, the Company’s cash flow is lower compared to the same period last year with a net decrease in cash and cash of equivalents in the observed period of HRK 1.48bn.
Outlook for FY 2022 remains positive even with price levels of Brent and CEGH gas prices stabilizing recently, futher amplified by ongoing uncertainty and turmoil with the Russia-Ukraine conflict, under the premise that new regulatory measures don’t additionally impact the market.
INA key financials (9M 2021. vs. 9M 2022, HRKm)
In 9M 2022, OMV Petrom recorded sales revenue growth of 60% YoY, EBITDA growth of 180% YoY, and a net income of RON 9.16bn, an increase of 446% YoY.
Sales revenue increased by 60% YoY, and amounted to RON 44.3bn, mainly supported by higher commodity prices and higher sale volumes of petroleum products and electricity. The Refining and Marketing segment represented 49% of the total consolidated sales, while the Gas and Power segment accounted for 51%. Sales from the Exploration and Production segment accounted for only 0.1%, being largely intra-group sales rather than third-party sales in Q3 2021.
Following the growth in sales, operating expenses also increased, growing by 123% YoY and amounted to RON 33.3bn. The largest contributions to this increase came from higher commodity prices in terms of oil and gas, whose purchase costs increased to RON 21.24bn, an increase of c. 3x YoY. Meanwhile, production and operating expenses increased to 3.9bn, an increase of 37.7% YoY, while Production and similar taxes increased to RON 4.49bn, an increase of more than 5x YoY, mainly as a result of higher volumes.
EBITDA increased significantly, growing by 180% YoY and amounting to RON 13.3bn. This was due to a higher contribution of all business segments, following an increase in prices in Exploration and Production segment, significantly higher refining margins in the Refining and Marketing segment, as well as solid margins on gas from storage and third-party transactions in the Gas and Power segment. The aforementioned increased purchases (in terms of both volumes and prices for all products) and higher Exploration and Production taxation also had an influence on the EBITDA result.
Interest income amounted to RON 500.8m, an increase of 350.8% YoY, while interest expenses increased by 73.1% YoY, amounting to RON 566.9m. Combined, this resulted in a net financial result of RON -73.1m, showing an improvement compared to the same period in 2021 when the net financial result amounted to RON -223.6m. The improvement mainly came due to higher interest income on bank deposits.
The income tax amounted to RON 1.7bn, representing an increase of more than 4x YoY, representing an effective tax rate of 16%, roughly the same on a YoY basis. All of this combined resulted in the net income to the majority of RON 9.16bn, an increase of more than 4x YoY.
OMV Petrom key financials (9M 2022 vs. 9M 2021, RONm)
Source: InterCapital research
Moving on to the balance sheet, as compared to the end of 2021, non-current assets decreased by 2.1% YoY, and amounted to RON 31.97bn, mainly as a result of a decrease in property, plant and equipment, as depreciation and the reduction in decommissioning assets following reassessment exceeded the additions during the period. Meanwhile, current assets increased by 45.8% YoY, and amounted to RON 25.2bn, mainly as a result of higher cash and cash equivalents, higher inventories following the increase in volumes and in unit costs, as well as higher trade receivables following higher sales, and higher fin. assets, mainly in relation to derivatives. In total, this would mean that assets amounted to RON 57.21bn, an increase of 14.5% YoY.
Equity increased by 13.9% YoY, and amounted to RON 39bn, mainly as a result of the net profit generated in the current period, which was partially offset by the dividend distribution for the financial year 2021. Total liabilities increased to RON 18.2bn, growing by 15.7% YoY, mainly due to higher current liabilities.
Finally, CAPEX amounted to RON 2.29bn in 9M 2022, an increase of 25.3% YoY. Investments in Exploration and Production amounted to RON 676m in Q3. Refining and Marketing investments amounted to RON 215m, while Gas and Power investments amounted to only RON 1m, with the majority of investments being directed to the planned outage at the Brazi power plant.