If you have CROATI€s on your portfolio, you have been asking yourself: should I sell? If you don’t have them, you have asked yourself: is it too late to get in? We’ll try to answer this question in this brief research piece.
CEE Eurobonds have performed really well since beginning of the week as EU’s rescue package became a done deal.
But first of all, what was actually agreed upon on July 21st? A rough breakdown goes like this: the Next Generation fund would include 750bn EUR worth of funds (390bn EUR in grants and 360bn EUR in loans) disbursed in the period of three years starting in 2021. Multiannual Financial Framework (MFF, some call it simply “EU budget“) is even bigger and set at 1.07 trillion EUR and this is actually the first time we have seen something coming from the EU with a letter t in front of it. The bad news about MFF is that it would be disbursed in longer period of time: 2021-2027. Both facilities are a huge deal and some of the analysts have dubbed this a historic, „Hamiltonian“ moment for the EU. This is truly a big step towards the mutualization of debt, but at the same time we have been assured that next steps would have to be done with a lot of negotiating and compromises.
A big question is what does that exactly mean for the financial markets? So from now on EU will be borrowing money and lots of it. We are quite confident that disbursements to member states would be matched by borrowing money on the financial markets and it’s quite likely that ECB might end up buying all of these newly issued EU bonds. This basically means that individual borrowing by member states would partially be replaced by EU level borrowing, making periphery countries with lower credit ratings the biggest beneficiaries. Actually, these countries were beneficiaries in the first place since they gained the upper hand during the allocation process. The most severely distressed countries received a bigger slice of the pie, making it quite reasonable to expect a rally on government bonds issued by these countries.
But does it mean that the ECB might stop with buying of individual countries’ debt now that it must buy EU debt? Well, we don’t think so. The reason is that ECB officials have made it quite clear they they would not let spreads to increase without control. It seems ECB officials now understand something local politicians in core EU countries still don’t get: all of the EU countries are now in the same boat and a hypothetical banking crisis in Italy caused by sovereign debt crisis would cross the border immediately and spread to the entire EU. Mutualization of debt was the only way to go. Of course, there is a risk of moral hazard, i.e. a spending spree in periphery countries. But EU officials thought on that to and installed thorough control mechanisms which would curb potential misuse of funds.
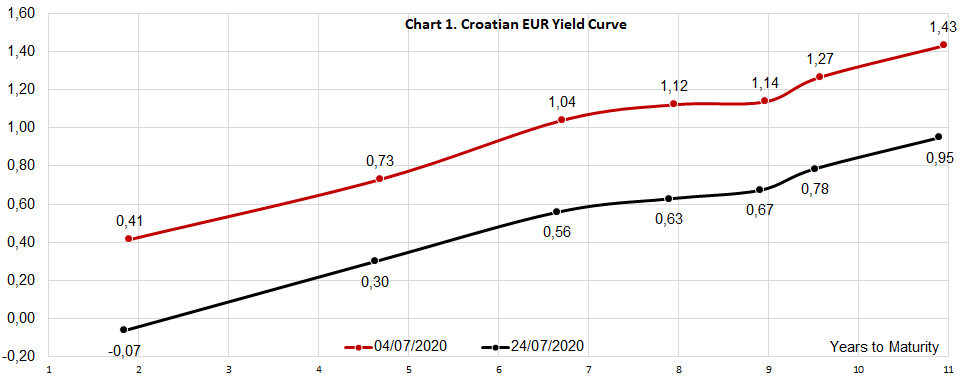
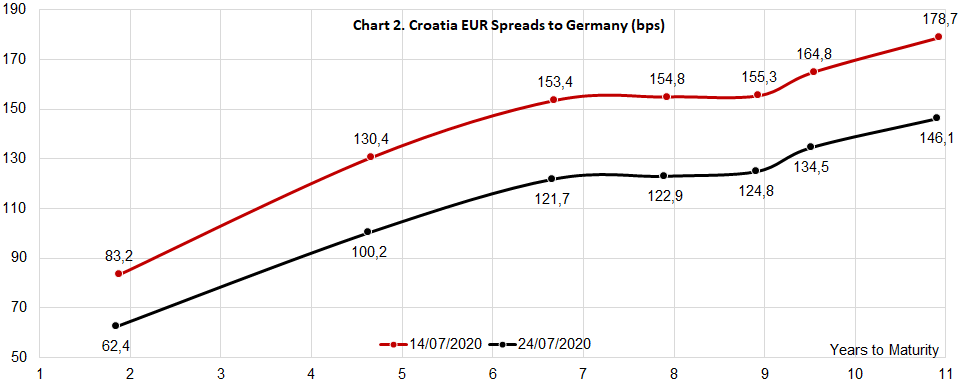
How did periphery bonds fare on this splash of money? Let’s take a close up on Croatia: as Chart 1. would suggest, yields went south and for the first time in a while we can see that there isn’t a single Croatian eurobond with a yield above 1.0%. Remember CROATI 1.5 06/17/31 issued at reoffer yield of 1.643% in mid-June? Trades now at 0.95% YTM without any friction and although we see limited domestic demand, foreign financial institutions don’t seem to get enough of it. The spread on the longest Croatian eurobond (31s) contracted by 32.6 bps since the beginning of the month (Chart 2., 178.7bps – 146.1bps = 32.6bps), so we can claim that out of total yield contraction in size of 48bps (Chart 1., 1.43% – 0.95% = 0.48%), two thirds came from the spread contraction. Thank you, EU.
How does this compare to the rest of CEE complex? ROMANI 3.624 05/26/30 went down from 2.53% YTM to 2.27% YTM (26bps of yield contraction), while REPHUN 1.625 04/28/32 went from 1.48% YTM to 1.15% YTM (33bps). It’s worth mentioning that both countries received a repo line from the ECB, Romania a bit sooner and Hungary received it yesterday. The impact of these repo lines might be larger on exchange rates than on eurobond spreads, but the impact is positive in both instances (i.e. it entails LCY appreciation and spread tightening). Once we line up Romania, Croatia and Hungary up against the wall, all three countries performed about 30bps of spread contraction on the long end. The effect of EU measures will be mostly felt on the long part of the yield curve because this is the place where growth prospects, ratings decisions and inflation expectations deliver it’s verdict on how much each country needs to pay to get the prerogative of borrowing money on international financial markets.
The final question is – does CROATI valuation look stretched now? We think not. Investors who think this way usually employ a one dimensional mindset, looking only at historic data. We tend to look left and right to see where other countries are priced and at the moment Croatia doesn’t look overstretched. Yes, economic fundamentals (namely high frequency tourist data) look a bit gloomy, but they are gradually improving. Meanwhile don’t forget all of the tailwinds Croatia has under it’s wings: ERM II accession, a stable government on top of situation and a tourist season that in the end didn’t turn out as bad as expected. Although we stick to the opinion that a sell off is always possible and that prices can’t go one way all of the time, we still bear to belief that in the long run this spread will get tighter and tighter.
So the spreads got really tight. So what? The show must go on. There are some big events on the horizon, such as November US elections. We have a feeling this might be the real show of this year.
In H1 Optima recorded a decrease in sales of -16%, flat EBITDA, and a net profit which turned negative to HRK -1.7m, from a net profit of HRK 5m.
In the first half of 2020, Optima Telekom recorded a decrease in sales of 15.7% YoY amounting to HRK 223.7m. Revenue decrease is mostly under the influence of a decrease in revenue from interconnection business activities of 64.9%, as a result of the reduction of business activities in the area of international voice services transit. This decrease in transit revenue is proportionally followed by transit costs decrease.
EBITDA before one-time items after leases was up 0.7% YoY and amounted to HRK 62.9m. Meanwhile EBITDA margin followed suit and amounted to 27.9% (4.6 p.p.).
The bottom line turned negative, amounting to a net loss of HRK -1.7m. The primary reasons for the decrease are higher finance costs (net), higher depreciation and impairment due to significant capital investments in the previous period, as well as higher influence of IFRS 16 items.
CAPEX amounted to HRK 51.5m, out of which HRK 6.3m was invested in user equipment for providing service to residential and business customers. Investments into the development of optical network, access network and core network amount to HRK 13.3m, while HRK 31.8m was invested in the expansion of customer services and IT system.
Optima Telekom Historic Financials
Petrol Approves EUR 22 DPS, DY 6.5%, ex-date August 5th
Petrol published a resolution from their AGM in which the shareholders approved EUR 45.2m to be allocated as dividend. This translates to a dividend per share of EUR 22 and is 22% higher than last year’s dividend of EUR 18 per share.
At the current share price dividend yield is 6.5% Note that the ex-dividend date is August 5th 2020.
In the graphs below, we are bringing you a historical overview of the company’s dividend per share and dividend yield.
Dividend per Share (EUR) & Dividend Yield (%) (2013 – 2020)
*compared to the share price a day before the dividend proposal