Down days have become more common for the FI crowd than up days, mostly because of the unwinding of Christmas rally-induced rate cut expectations. However, the situation is much different compared to five years ago because much of the CROATIs are now sitting in the diamond hands of long-term asset managers, instead of the shakey hands of UCITS funds. Benchmark prices are dropping, but funds are not popping – ergo the spread tightens even further. How do we trade this regime? Find out in this brief research piece.
Last week was just another point in a string of hot inflation prints that might cause FOMC to postpone rate cuts. PPI figures were slightly hotter than anticipated, providing the empirical foundation for sticky inflation trades: PPI final demand made its way to 0.9% YoY (versus 0.6% YoY BBG consensus estimate); PPI excl. food and energy rose by 2.0% YoY (versus 1.6% YoY BBG consensus). US CPI figures were released just three days earlier, also beating analyst consensus (3.1% YoY versus 2.9% YoY BBG consensus), a signal that FED rate cuts might be subject to further revision and that the path to 2.0% inflation is all but clear. Actually, FOMC minutes from the January meeting released yesterday were interpreted in such a tone – no need to rush rate cuts. Asset managers reacted to the two prints in a familiar fashion: according to Bloomberg (actually CFTC data), AMs unwound a total of 260k 10Y futures (largest dump since March 2022) after the CPI print, just to start building up front-end short positions after hot PPI. JP Morgan’s client survey released yesterday stated that all-client net long positions dropped to the lowest figure since April last year. Speaking about market reaction, compare the change taking place on WIRP US from EOY 2023…
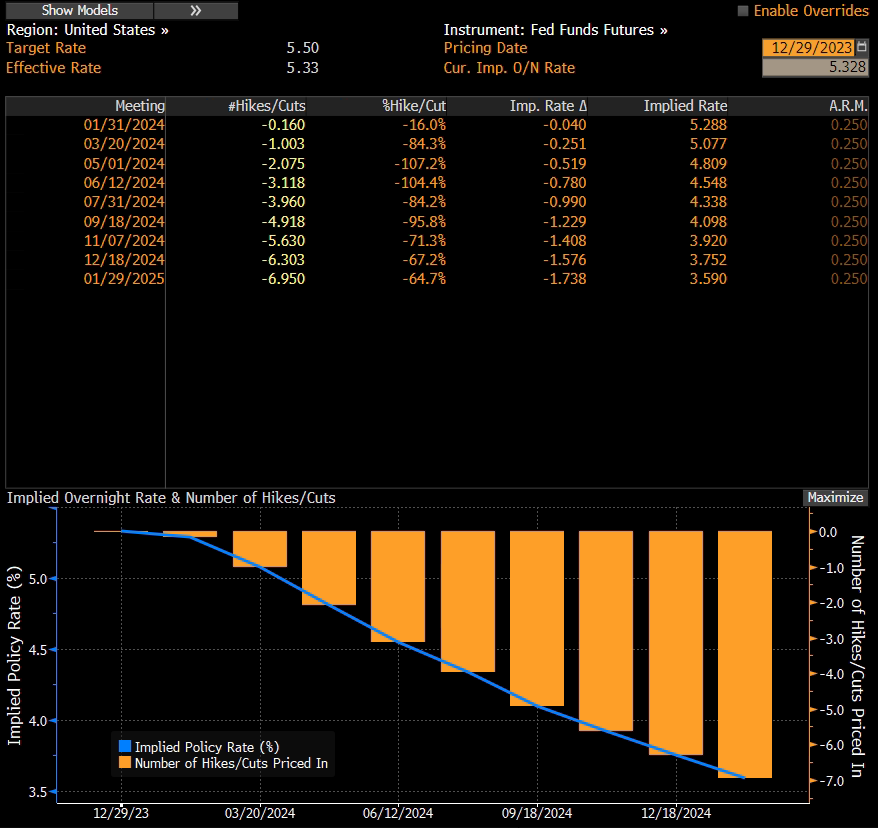
… compared to today’s:
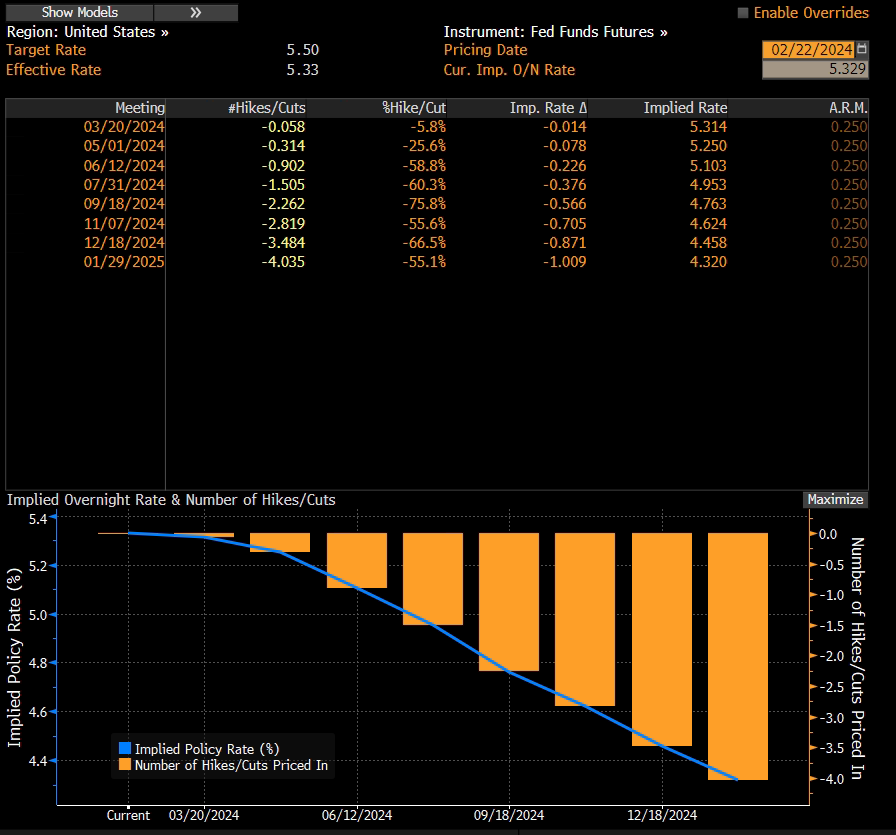
Historically, January data is prone to seasonal adjustments and for the FED rate cut path to become clearer markets will have to wait and see for more data points in the coming months. At this moment, FED fund rate futures are pricing three full cuts in 2024 beginning in June/July. Markets were also slightly disturbed by former Treasury Secretary’s Larry Summers statement that there might be a small chance of raising interest rates even further should the goods deflation cease and headline figures start increasing all over again. Summers is a notorious hawk and a critic of monetary easing in all forms, possibly because of the effect it had on active portfolio management at the benefit of passive, low-to-no-fee strategies, so his statements might be taken with a grain of salt.
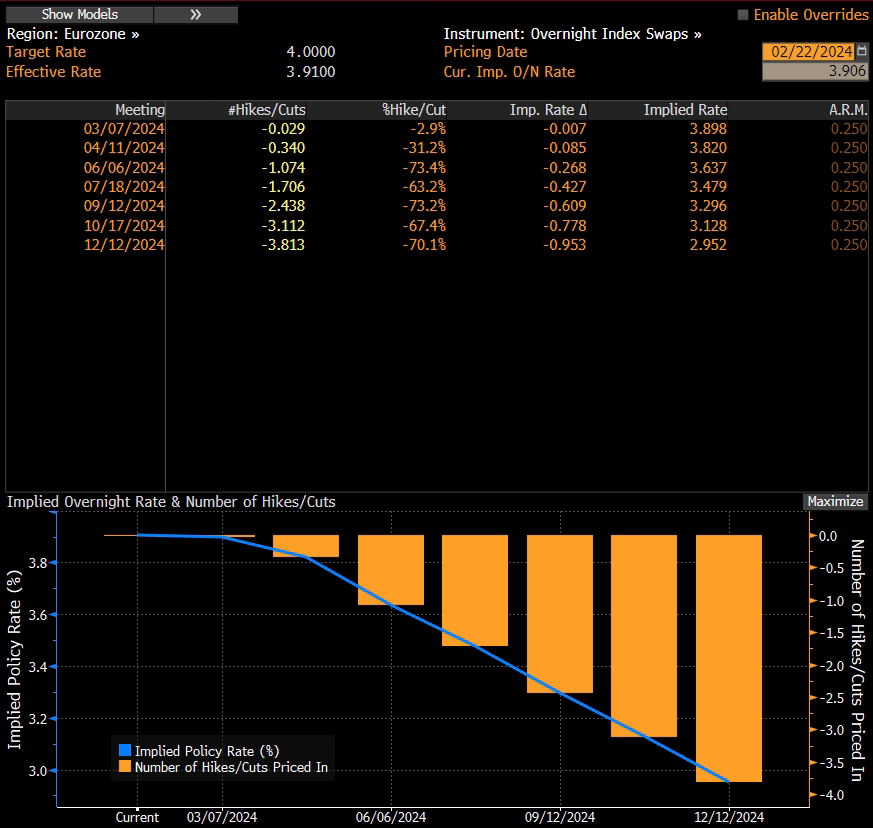
Meanwhile, in Europe, the situation is similar in terms of rate cut expectations. The ECB released yesterday wage growth figures that showed easing for the first time in 18 months, a favourable story for doves hiding in the GC. On the other hand, the inflation rate is still above 3% which is a long way from the 2% target, services CPI is quite sticky and the unemployment rate remains at a record low of 6.4%, all of which suggest solid economic indicators, so wise move would be to wait for April ECB meeting to see Q1 2024 numbers before making any judgments on rate cuts. Our stance is that the ECB will be likely to push rate cuts later in the year, much like the FED, and potentially wait for the FED to make a move in downgrading direction first.
What’s going on with CEE bonds? Well, here’s the kicker – to answer that question, just take a look at what’s going on with SPGB 3.25 04/30/2034€ in terms of spread to German paper:
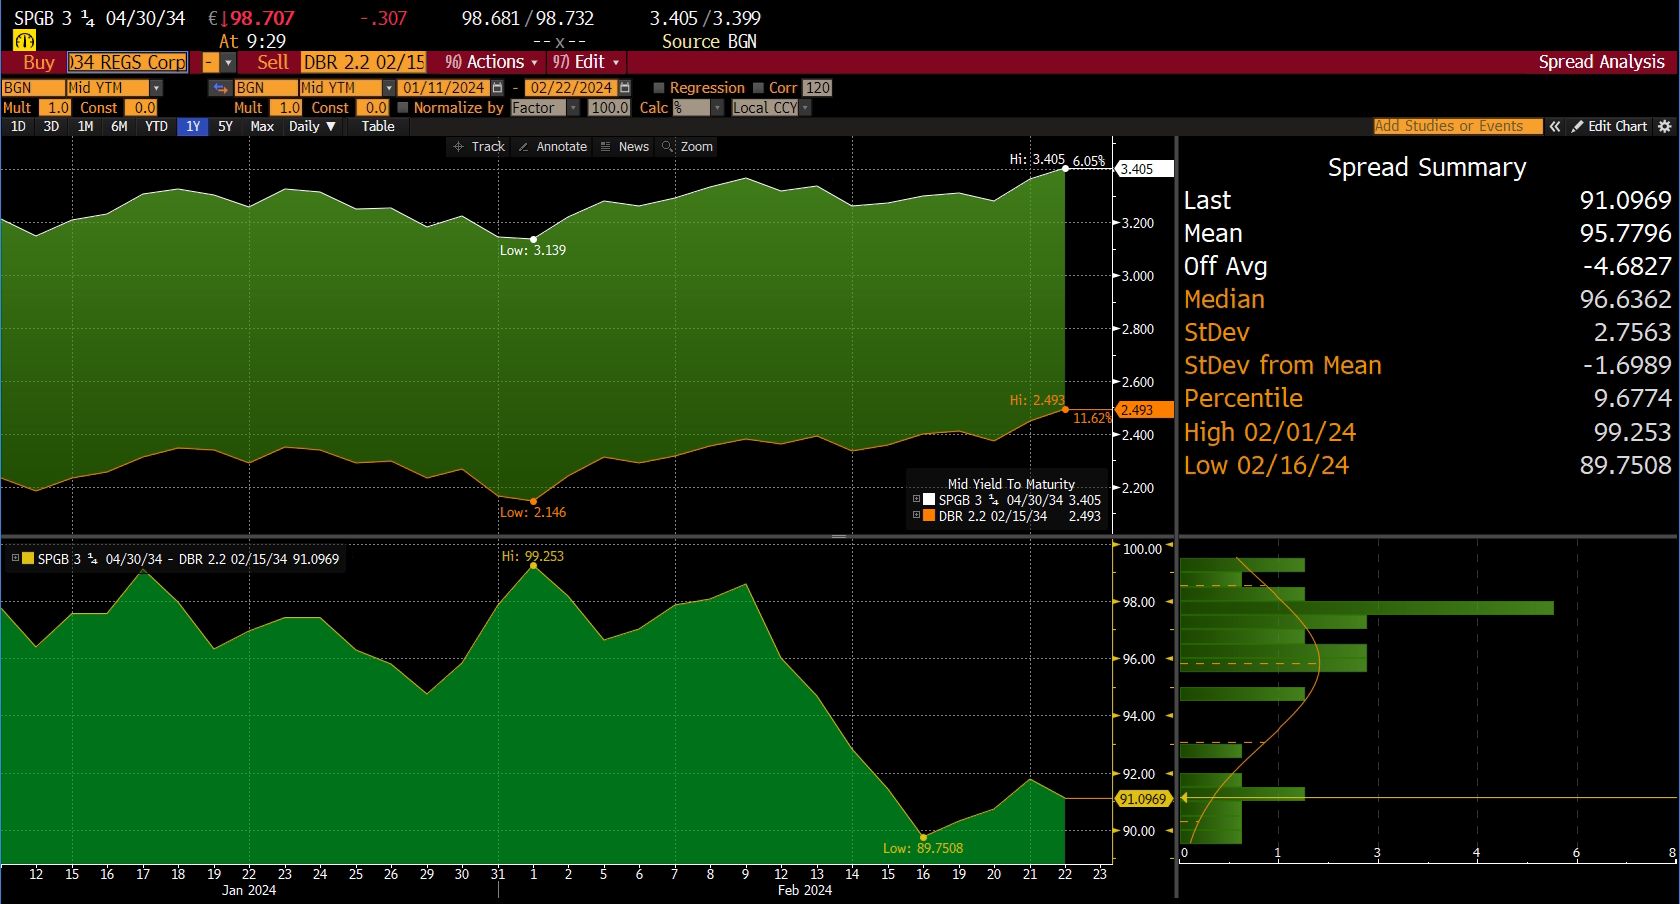
It’s getting tighter and tighter, now standing at B+91bps. The same is happening with CROATI€ curve as the two charts might suggest. This is not due to market illiquidity, but we see a couple of Street dealers that remained short CROATI 4 06/14/2035€ after the Ministry of Finance skipped international bond placement in January and domestic asset managers had to be invested. We are unsure of how that would hold, however, look for Spanish spread for clues on where CROATI€ is heading. Currently, the CROATI€ spread on the long end is around 100bps, meaning that the markets might have already given Croatian bonds the rating upgrade we have all been waiting for.
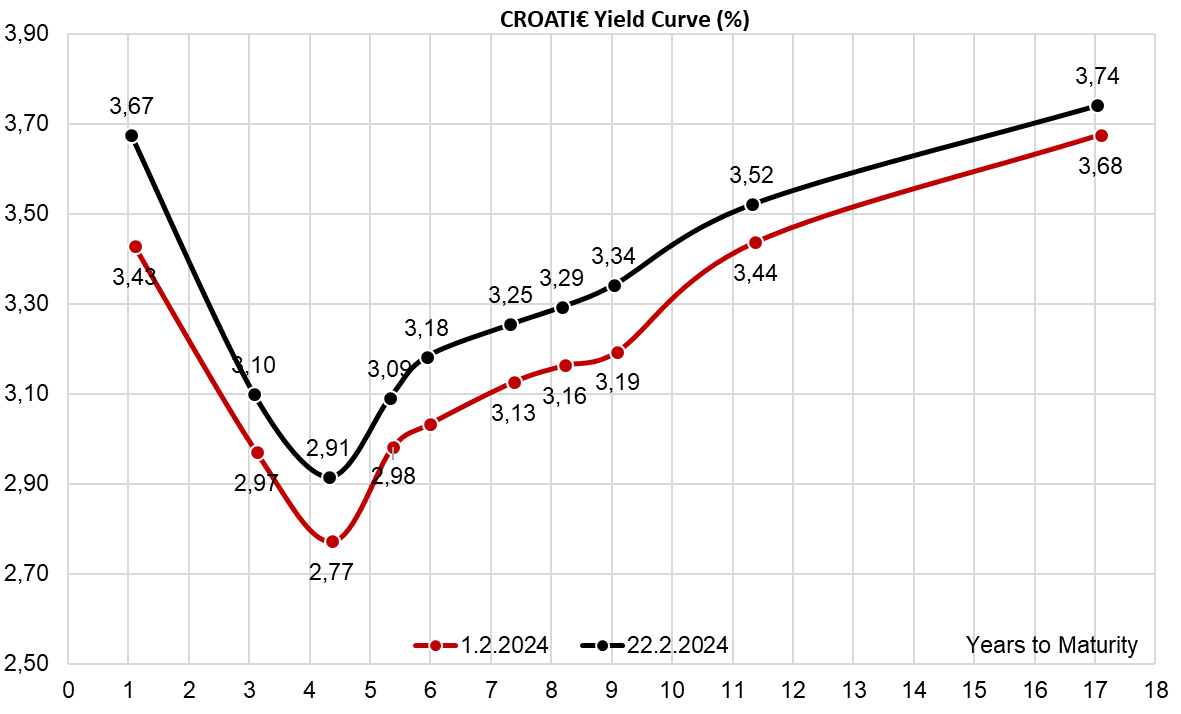
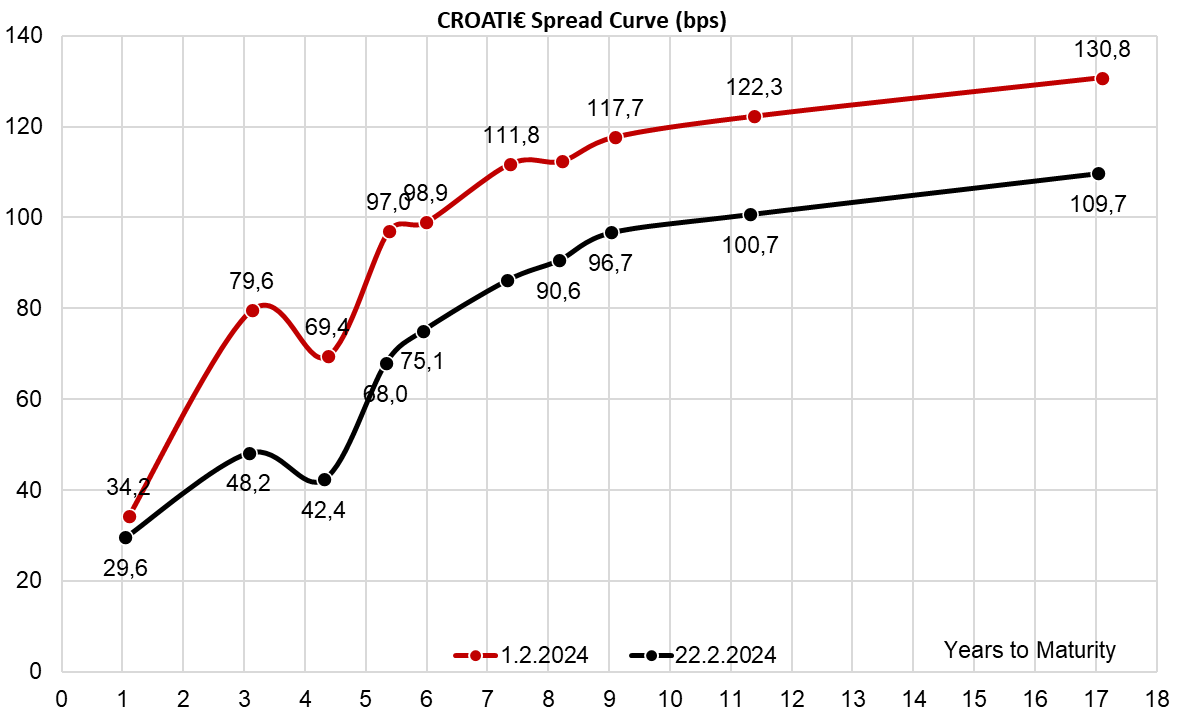
Source: Bloomberg, InterCapital
Yesterday, NLB’s shares closed the day at EUR 102 per share, marking the 1st time in its history that the Company’s shares closed above triple-digits. This came after the latest share price increase, with the share price increasing by as much as 3% yesterday!
The story of the triple-digit breach for NLB’s shares goes back a couple of weeks now, with the Company’s shares breaching the magical barrier several times already, but never closing above the said point. This changed yesterday for the 1st time in its history, with the Company’s share price ending yesterday’s trading at EUR 102 per share.
This growth has been a culmination of the increase in share price that the Company’s share recorded, especially in the 2nd half of 2023. In fact, since the start of 2023 up until the present, NLB’s share recorded a return of over 63.5%! During the same period, the SBITOP index achieved a return of “only” 32%.
Performance of NLB, SBITOP (2023 – 2024 YTD, %)
Source: Bloomberg, InterCapital Research
This growth was supported by the general macroeconomic environment, which due to the high inflationary pressures recorded from the 2nd half of 2022 and which remained for most of 2023, meant that the ECB increased interest rates on deposits significantly. This also led to the interest rates on loans increasing, which benefited NLB really well. In fact, NLB’s net income should come close to the one recorded in 2022, despite not having the effect of negative goodwill from 2022, in the amount of EUR 172.9m present!
Furthermore, the Bank recorded a low cost of risk (negative for most of the year, and in its future guidance at 30 – 50 bps), meaning that not only was it achieving higher interest rates on loans, but the ratio of “bad” loans did not increase significantly, while some older loans which were deemed so were able to be resolved.
Going further, despite the expectations of a general recession in the Eurozone, and especially in Slovenia’s main trading partners such as Germany, the Slovenian companies which are largely export-orientated haven’t recorded problems in their operations, which also contributed to lower than expected levels of risk.
For households, the rate of loan growth has slowed down to a large extent due to the higher interest rates, but the rates applied to current loans are high. Furthermore, most fixed interest rate loans from before are only fixed for a certain time period, say 10-15 years, meaning that the longer time that passes with these elevated interest rates, the more of the fixed interest rates loans that are in this category will switch to variable rates, which is also supportive of the net interest margin growth despite the slowdown in the new loan issuance.
Lastly, as NLB operates in the SEE region, there is still a lot of growth potential present. All of these factors, the expectations of solid results, the recently announced M&A, as well as the fact that NLB is still trading at a P/B of app. 0.70x means that the share is still relatively “cheap” and attractive.
Yesterday, Cinkarna Celje went ex-date, and as a result, the Company’s shares declined by 12.9%.
The ex-date refers to the Cinkarna Celje’s dividend payment this year, in the amount of EUR 3.2 DPS, and a DY of 15.3%. The payment date is due on 23 February 2024.
As a reminder, the ex-date is the last date that investors are eligible for the dividend payment, after which everyone who becomes a shareholder of the Company’s shares won’t be eligible for the dividend payment. As such, it is usually expected that on the ex-date the Company’s share price declines in the amount of the dividend yield.
This came to pass this time as well, with Cinkarna Celje’s share price declining “only” by 12.9%, which is below the 15.3% DY meaning that effectively Cinkarna’s share price appreciated in real terms yesterday.
Below we provide you with the historical dividends per share as well as the dividend yields of the Company. If you want to read more about dividend approval and previous counterproposal, click here.
Dividend per Share (EUR) and Dividend Yield (%) (2012 – 2024)
Source: LJSE, InterCapital Research