Ericsson NT published their FY 2019 results yesterday which they presented at an analyst conference held at their headquarters in Zagreb. Today we bring you an overview of those results, coupled with some key takes from the conference.
In 2019 Ericsson NT’s sales went up 14.2% YoY, amounting to HRK 1.8bn with sales growth witnessed in all markets. During 2019, Ericsson NT’s focus remained on network modernization for their customers in Croatia and abroad, development of new solutions in 5G, and strengthening of their technological leadership.
Sales in the domestic market amounted to HRK 497m, marking a high growth rate of 33.4% YoY. Note that this represents the second year in a row that Ericsson NT’s domestic market sales grew more than 30%, thus almost doubling their sales in two years’ time. Ericsson’s operations on the domestic market in 2019 were marked by projects connected with the preparation of both HT’s and A1’s network infrastructure for the commercial introduction of 5G technology after the necessary radio-frequency spectrum is assigned for it. Meanwhile, Ericsson NT also worked with Tele 2 to increase the database capacity with 4G user information and upgrade of the entire core network to the latest software release.
Export markets sales increased by 10.8% YoY, amounting to HRK 254.6m. From this market one should highlight that, in Bosnia and Herzegovina, 2019 was marked by the issuing of the long-awaited licenses for introduction of the fourth generation of mobile communications. As a result, Ericsson NT worked with the operator HT Eronet on the expansion of LTE network across Bosnia and Herzegovina. In other parts of the regions Ericsson NT continued to cooperate on modernization and maintenance of telecommunication networks with the operators Crnogorski Telekom (Montenegro) and IPKO (Kosovo). In the market of Belarus, the company continued their cooperation with the operator beCloud on the project of LTE network expansion. In ICT Industry & Society segment Ericsson NT signed an agreement on the continuation of healthcare system maintenance for the needs of the Ministry of Healthcare of Armenia. Also note that the project of healthcare system informatization in Kazakhstan, which was obtained in 2018, has successfully completed the managed services phase and entered the maintenance phase.
In the Ericsson market, sales passed the HRK 1bn mark, representing a 7.5% YoY increase. The increase came as a result of Ericsson NT’s continues increase of R&D responsibilities in the 5G area.
Of the total sales revenue, domestic market accounts for 28%, services to Ericsson account for 57.7% (of which 10.4% is related to Managed Services in Croatia), while other export markets account for 14.3%.
Sales Breakdown
Sales-wise, one should highlight the concern regarding the high share which the parent company has in the Group’s sales. As one can see on the chart above, Ericsson NT’s parent company has been responsible for more than half of the Group’s sales for the past several years. As a result, any kind of volatility in the parent company’s business operations could have a strong impact on Ericsson NT. However, some changes in the sales structure will be occurring during 2020, but more about that later.
Before we continue to the operating and bottom line there is one important thing to take into consideration. In 2018, Ericsson NT’s results were positively impacted by the incentives based on the Investment Promotion Act, while in 2019, the positive impacts of this Act are visible exclusively in the tax liability decrease, i.e. effective tax rate.
Gross profit amounted to HRK 164.5m which represents a 16% YoY increase. The rise in gross profit can be attributed to higher sales revenue. Meanwhile the gross margin remained stable at 9.2% (compared to 9.1% recorded in 2018). Thus, showing the stability of ongoing and completed projects’ gross margins.
EBIT amounted to HRK 102.6m, representing a 14.5% YoY increase, due to the abovementioned tax incentives.
Finally, the bottom line amounted to HRK 102.6m, representing a 9.7% YoY decrease. Meanwhile the net profit margin also fell, amounting to 5.7 (-60 bps).
Ericsson NT Key Financial (HRK m)
What to expect in 2020
Earlier this year Ericsson NT announced that they are taking over the full responsibility for building and maintaining HT’s telecommunications infrastructure from their parent company. Since Ericsson NT previously acted as a sub-contractor of the global Ericsson, this revenue was recorded under the Ericsson market and ranged between HRK 160-180m every year (in 2019 it a was HRK 188.5m). Now as the company took over the full responsibility on to themselves, the expected contribution to the top line is around HRK 500m or more, however note that the HRK 180m recorded through the Ericsson market will disappear. Still, a nice net increase of roughly HRK 300m can be expected.
Furthermore, with the recent acquisition of Tele 2 Croatia by the United Group an opportunity to re-establish cooperation in providing telecommunication equipment and services to Tele 2 Croatia has emerged. If Ericsson NT manages to secure any kind of new deal with the new management, one could expect a positive contribution to the top line in the final quarter of this year.
However, we’d like to end on a bit more warily note. Our estimate is that 2020 will definitely be a year of both risks and opportunities for Ericsson NT. On one hand, new revenue from new responsibilities and potential cooperation could boost results, but on the other hand CAPEX from major Croatian telcoms is expected to decrease as they have all successfully prepared themselves for the unveiling of the 5G network. Furthermore, the licenses for the 5G radio-frequency spectrum will be allocated in the second part of 2020 and surely one cannot expect additional revenue from 5G operations to start pouring in instantaneously. Finally, as Ericsson NT holds a market share of more than 80% on the domestic market, the company will have to work closely with their customers in order to design new profitable services and projects for the upcoming new technology.
In 2019, INA recorded an increase in sales of 1%, a a decrease in EBITDA of 18% and a decrease in net profit of 58%.
Ina published their preliminary FY 2019 results. According to the report, INA recorded sales of HRK 22.6bn, showing a slight increase of 1% YoY. The mentioned increase came mainly on the back of higher wholesale, lack of supply from Bosanski Brod Refinery and sales growth on captive market.
Meanwhile, operating expenses amounted to HRK 22.57bn, representing an increase of 4% YoY. Such an increase could be attributed mostly to higher cost of goods sold (+97%), resulting from higher import of goods to meet market demand. Such an increase was partially offset by lower costs of raw materials and consumables (-30%), resulting mainly from lower processing triggered by Rijeka Refinery turnaround from January until May.
CCS EBITDA excluding special items came in at HRK 2.9bn in 2019, a decrease of 7% compared to 2018, mainly due to the 10% decline in Brent crude price.
Exploration and Production revenues and EBITDA excluding special items decreased in 2019 by 11% and 22% respectively, on the back of 9% lower realized hydrocarbon prices and a 3% decline in hydrocarbon production.
Overall production volumes were supported by higher crude oil production in Egypt, which was more than offset by the natural decline on Croatian fields, especially on gas fields. Refining and Marketing including Consumer Services and Retail CCS EBITDA excluding special items amounted to HRK 557m in 2019, increasing by HRK 271m year-on-year, while Simplified Free Cash Flow of the segment was negative HRK 779m in 2019 due to the negative Refining and Marketing cash flow.
In 2019, INA recorded a negative net result from financial activities of HRK -76m, which is an improvement of HRK 91m as a result of a lower net FX loss and lower interest payables compared to 2018.
In 2019, INA’s net profit amounted to HRK 489m, representing a decrease of 58%. When observing solely Q4, INA recorded a net loss of HRK 192m, compared to HRK 120m in Q4 2018.
The main events of the year for Refining included a large-scale turnaround completed in May and also the final investment decision on Rijeka Refinery Upgrade Project, the largest investment in the recent history of INA. At the same time sales were stable, utilizing market conditions. Higher retail volumes (+ 3%) resulted from the improving performance in Croatia and the network expansion in Montenegro.
Turning our attention to CAPEX, in 2019 investments were higher by 18% YoY, amounting to HRK 2.15bn, with increased investments in Refining and Marketing. Net gearing amounted to 18.5% with net debt standing at HRK 2.55bn at the end of 2019.
In 2019, the company recorded a decrease in operating revenues of 2% YoY, a decrease in EBIT of 29.3% and a net profit of RON 349.5m (-29.5%).
As Transgaz published their preliminary FY 2019 report, we are bringing you key takes from it. In 2019, the company recorded operating revenue before the balancing and construction activity, according to IFRIC12 of RON 1.58bn, representing a decrease of 2%. Of that, revenue from the domestic transmission activity accounts for 76%. The operating revenue was down as the commodity component revenue was lower by RON 61.29m.
The company notes that the decreasing of the tariffs in 2019 as compared to 2018 is mainly due to:
- a lower approved revenue in gas year October 2018- September 2019 (RON 882.98m) as compared to the revenue approved in gas year October 2017 – September 2018 (RON 954.3m) mainly because of the differences for the adjustment of the revenue in gas year 2018-2019.
- the commodity tariff is lower according to Order 10/2017 of the ANRE President on the amending and supplementing of Order 32/2014 of ANRE President on the approval of the Gas Transmission Regulated Revenue, Total Revenue and Regulated Tariffs Methodology, which establishes the increasing by 5% per year of the percentage by which the approved revenue is recovered by the application of the capacity booking tariff, up to 85%, and the decreasing of the percentage by which the approved revenue is recovered by the application of the commodity tariff. In gas year 2018-2019 the variable component of the total revenue at the basis of the commodity tariffs is 30% of the total revenue and in gas year 2019-2020 it decreased to 25% of the total revenue.
Turning our attention to operating costs, they observed a solid increase of 12.6% YoY, amounting to RON 1.18bn. Such an increase can be attributed mostly to higher other operating expenses by 56.3% and higher taxes and other amounts owed to the state (+42.2%).
Going further down the P&L, as a result of the above mentioned, Transgaz recorded a solid decrease of operating profit by 29.3% YoY, amounting to RON 396.7m. In 2019, the company recorded a net financial result of RON 19.5m, which further boosted the bottom line, however such result is by RON 1.88m lower compared to 2018.
Net profit in 2019 amounted to RON 349.5m, representing a decrease of 29.5%. Such a result translates into RON 29.68 EPS.
For today, we decided to present you with a short asset structure analysis of Slovenian mutual funds.
Yesterday we presented you with a brief asset structure analysis of Croatian UCITS funds. Consequently, for today we decided to present you with a short analysis of the asset structure of Slovenian mutual funds.
When looking at the graph below, one can notice that the Slovenian mutual funds have not significantly changed their assets structure in the past decade.
Unlike the Croatian funds, which have in the past years witnessed an increase in debt securities in their asset structure (65.9% of asset structure in 2019), Slovenian asset managers are more prone to investing in equities. As of January 2020, shares account for 68.3% of the total assets structure of mutual funds, which is slightly below the historic average (in the observed period) of 70.3%. Note that the equity holdings of Slovenian mutual funds reached their peak in September 2007, when they accounted for 76.4% of the total asset structure.
Next come bonds, which make up for 17.8% of the total asset structure, and which have in the past years been witnessing a steady increase. Investment funds and money market follow deposits & cash make up 7% and 6.2%, respectively.
As of January 2020, Slovenian mutual funds manage EUR 3.05bn (+16.9% YoY), which is at its historic high. It is worth noting that mutual funds were at their low in March of 2009, when the total assets under management amounted to EUR 1.42m. This occurred partly due to lower asset value, as well as due to funds outflow as investors pulled out their funds.
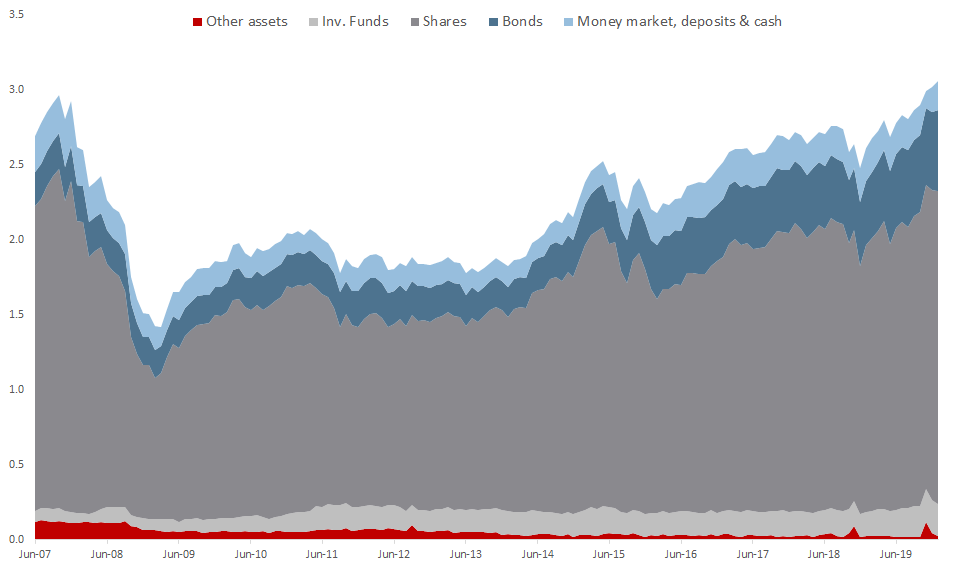
Source: Securities Market Agency, InterCapital Research