As inflation has been a primary topic of financial markets for quite some time now, it is interesting to see the real returns of Croatian and US equities. Double-digit inflation occurred in the whole region, while the US currently stands at high single-digit levels. Consequently, in this blog, we showed how inflation impacted real historical returns on the market, which especially stands out in 2022. For this, we looked at the total return of both CROBEX and S&P500 since 2010 and deducted the reported yearly annual CPI (inflation measure).
For today we decided to present you with a brief analysis of the real return of two equity indices – CROBEX and S&P500 since 2010. Note that both indices are total return indices, meaning they account for dividends’ reinvestment.
Annual Return of the Index vs. Annual CPI
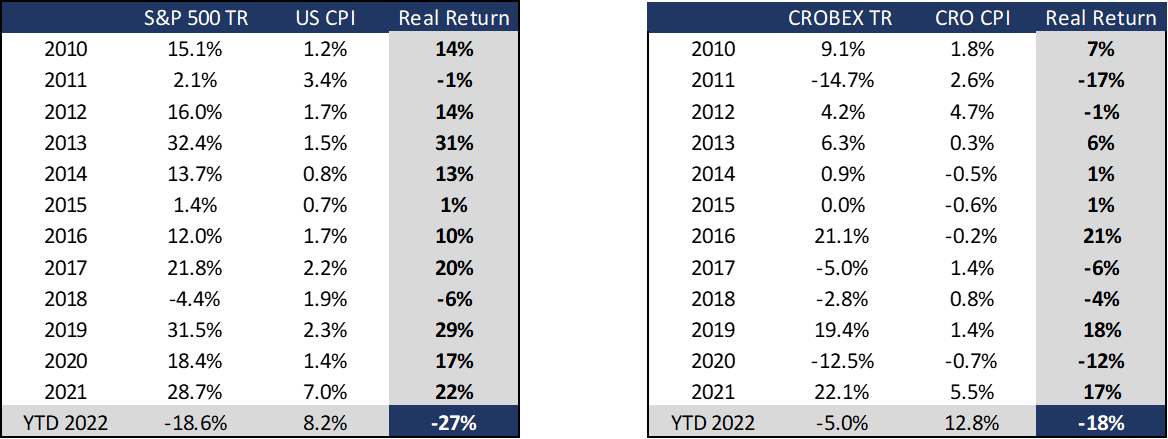
Source: Bloomberg, InterCapital Research
As seen from the table above, the 2010s were depicted with relatively low inflation figures and solid performance of the US equity market. Actually, until 2022, we had a more or less similar situation – solid equity growth combined with low single-digit inflation. Therefore, one can note that the S&P500 noted a positive annual real return in 10 observed years, while CROBEX noted a positive return in 7 observed years.
2011 was the only year in which the US market witnessed a negative real return, despite noting a positive nominal return, while 2018 is the only year investor would record a negative real yield due to capital loss. Meanwhile, in Croatia, CPI showed negative figures from 2014 – 2016, somewhat boosting the real return of CROBEX. Therefore, despite a flat CROBEX in 2015, the real return of the index remained positive. Also, one can notice that 2021 is the first year to report a higher YoY inflation rate after a long period of time, while equity performed strongly nevertheless, with a solid double-digit growth both in US & Croatia. However, one can note a shift in equity performance 2022 YTD.
Additionally, it is interesting to see how the markets performed in real terms if an investor decided to invest in both indices in 2010. As visible from the table below, investing in CROBEX in 2010 resulted in a negative real return from 2011 to 2015. However, despite this in 2021 one would observe a strong real return of 17%. If we were to also take into consideration the 2022 YTD performance of CROBEX and adjust it for CPI, one would note a total real return of -18%. Such a relatively poor performance could be attributed to a slight decline of CROBEX combined with double-digit inflation.
When looking at S&P 500, one could note that the index noted a significantly higher real return, which does not surprise given that the observed period refers to the longest bull run of US equities. Adjusting for inflation, S&P500 returned (total return) 303% from 2010 – YTD 2022. Just like in the region, US equities also took a solid hit during YTD 2022 performance, as S&P 500 declined 18.6% & USA noted an 8.2% inflation. Nevertheless, investors would benefit strongly from owning the US index in the observed period.
Cumulative Real Return of Investing in S&P 500 & CROBEX since 2010

Source: Bloomberg, InterCapital Research
In 9M 2022, Nuclearelectrica recorded an operating revenue increase of 125% YoY, an EBITDA growth of 126%, and a net profit of RON 1.94bn, an increase of 203% YoY.
During the 9M 2022, Nuclearelectrica recorded an op. revenue increase of 125% YoY, amounting to RON 4.9bn. The increase was driven by the increase in revenue from the sale of electricity, due to the 138.2% increase in the weighted average selling price of electricity, including the transmission to power grid tariff (transmission tariff “Tg”).
In terms of the quantity sold, the Company sold a 4.1% lower amount of electricity due to lower electricity production by 2.1%. In 2022, the planned shutdown of Unit 1 took place, with a longer-than-planned shutdown of Unit 2 in 2021, which influenced the decrease in production. The amount of electricity sold on the competitive market of bilateral contracts decreased by 4% YoY, while the average selling price on this market increased by 113% (price without Tg). The amount of electricity sold by SNN on the spot market (DAM and IDM) decreased by 5.5%, while the average selling price increased by 256% YoY.
Meanwhile, OPEX (excl. depreciation and additional income tax expense) increased by 36.9%, and amounted to RON 1.39bn, mainly as a result of the increase in expenses regarding the purchased electricity, as well as the increase in personnel expenses.
The additional income tax expense referred to here, is the tax that was recently changed due to the current situation in the energy sector. In the period 1 January – 31 August 2022, the additional income which came from the difference in the average monthly electricity selling price, and the price of RON 450/MWh were taxed at 80%. Starting with 1 September 2022, this was replaced by the solidarity contribution, amounting to 100% of the difference between the average monthly electricity selling price and the price of RON 450/MWh. This change is in place until 31 August 2023. What this means for SNN, is that it had to pay RON 872.9m of additional expenses, on top of the OPEX.
Even with this increase, the EBITDA still grew strongly, growing by 126% YoY and amounting to RON 2.65bn. This would imply an EBITDA margin of 53.95%, an increase of 0.34 p.p. YoY, which just means that both the revenue and op. profitability grew proportionally. Because of this, the EBITDA growth can solely be attributed to the top-line growth. The financial income for the period amounted to RON 72.5m, an increase of 426%, mainly as a result of higher interest income, but also supported by FX differences. Financial expenses also grew, to RON 8.4m, an increase of 45% YoY. This would mean that during the period, the net financial result amounted to RON 64m, an increase of 7x YoY. As a result of the higher earnings, tax expense amounted to RON 373m, an increase of 184% YoY. Finally, the net income for the period amounted to RON 1.94bn, an increase of 203% YoY.
Nuclearelectrica key financials (9M 2022 vs. 9M 2021, RONm)
Source: Nuclearelectrica, InterCapital Research
The investment of the Company is set at RON 609.2m for 2022, which is an increase of 44% YoY. In the 9M 2022, they managed to achieve 69.3% completion of this planned investment. The investments were made into the production continuity of the Company’s branches, in order to achieve the highest possible level of production capacity utilization, as well as to maintain the long-term maintenance of the plant.
Nuclearelectrica also commented on the impact of the Ukraine conflict on its operations. They concluded that there is no direct exposure related to Russia or Ukraine, nor do they hold any direct or indirect investments in companies in these countries. The supply chain for raw materials is maintained this year with companies established in Kazakhstan and Romania. Furthermore, SNN has no exposure to businesses, companies, or banks which are currently affected by international sanctions. The indirect effect, however, is the same one all other companies are experiencing: electricity sale price growth, national policies for mitigating the effects of the Ukraine war, and the CPI evolution.