As inflation has been a primary topic of financial markets for quite some time now, it is interesting to see the real returns of Croatian and US equities. Double-digit inflation occurred in the whole region, while the US currently stands at high single-digit levels. Consequently, in this blog, we showed how inflation impacted real historical returns on the market, which especially stands out in 2022. For this, we looked at the total return of both CROBEX and S&P500 since 2010 and deducted the reported yearly annual CPI (inflation measure).
For today we decided to present you with a brief analysis of the real return of two equity indices – CROBEX and S&P500 since 2010. Note that both indices are total return indices, meaning they account for dividends’ reinvestment.
Annual Return of the Index vs. Annual CPI
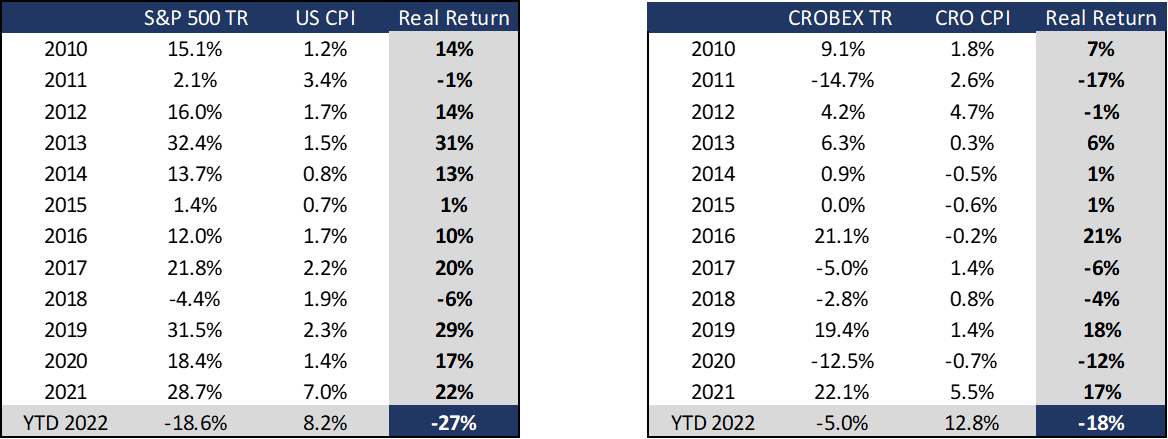
Source: Bloomberg, InterCapital Research
As seen from the table above, the 2010s were depicted with relatively low inflation figures and solid performance of the US equity market. Actually, until 2022, we had a more or less similar situation – solid equity growth combined with low single-digit inflation. Therefore, one can note that the S&P500 noted a positive annual real return in 10 observed years, while CROBEX noted a positive return in 7 observed years.
2011 was the only year in which the US market witnessed a negative real return, despite noting a positive nominal return, while 2018 is the only year investor would record a negative real yield due to capital loss. Meanwhile, in Croatia, CPI showed negative figures from 2014 – 2016, somewhat boosting the real return of CROBEX. Therefore, despite a flat CROBEX in 2015, the real return of the index remained positive. Also, one can notice that 2021 is the first year to report a higher YoY inflation rate after a long period of time, while equity performed strongly nevertheless, with a solid double-digit growth both in US & Croatia. However, one can note a shift in equity performance 2022 YTD.
Additionally, it is interesting to see how the markets performed in real terms if an investor decided to invest in both indices in 2010. As visible from the table below, investing in CROBEX in 2010 resulted in a negative real return from 2011 to 2015. However, despite this in 2021 one would observe a strong real return of 17%. If we were to also take into consideration the 2022 YTD performance of CROBEX and adjust it for CPI, one would note a total real return of -18%. Such a relatively poor performance could be attributed to a slight decline of CROBEX combined with double-digit inflation.
When looking at S&P 500, one could note that the index noted a significantly higher real return, which does not surprise given that the observed period refers to the longest bull run of US equities. Adjusting for inflation, S&P500 returned (total return) 303% from 2010 – YTD 2022. Just like in the region, US equities also took a solid hit during YTD 2022 performance, as S&P 500 declined 18.6% & USA noted an 8.2% inflation. Nevertheless, investors would benefit strongly from owning the US index in the observed period.
Cumulative Real Return of Investing in S&P 500 & CROBEX since 2010

Source: Bloomberg, InterCapital Research
