As 2021 has ended, we bring you a brief analysis of the total market capitalization of listed companies as a % of GDP in countries from the region – also known as Buffet’s indicator.
The market cap to GDP ratio, or the Buffet Indicator as it is sometimes referred to, due to the fact that it was popularized by the famous investor Warren Buffet, compares the market capitalization of all publicly-traded stocks on a single market with the country’s GDP.
This ratio compares the “price” of the companies on capital markets (prices include positive expectations, thus increasing market capitalization) and the real economy: produced goods and services within the country. The logic that lies within this ratio should give us rough aggregate pricing data in one country. The higher the ratio is, the more “expensive” companies on the capital market are, compared to the real economy. The ratio could be higher by increasing the market capitalization of companies or if a sharp decline in GDP occurs, without decreasing in market capitalization.
It was one of the indicators of the approaching storm and later the crises in 2008, which severely damaged the equity markets. As Buffett said, “The ratio has certain limitations in telling you what you need to know. Still, it is probably the best single measure of where valuations stand at any given moment” so it is often used to determine whether the stock market is overvalued or undervalued.
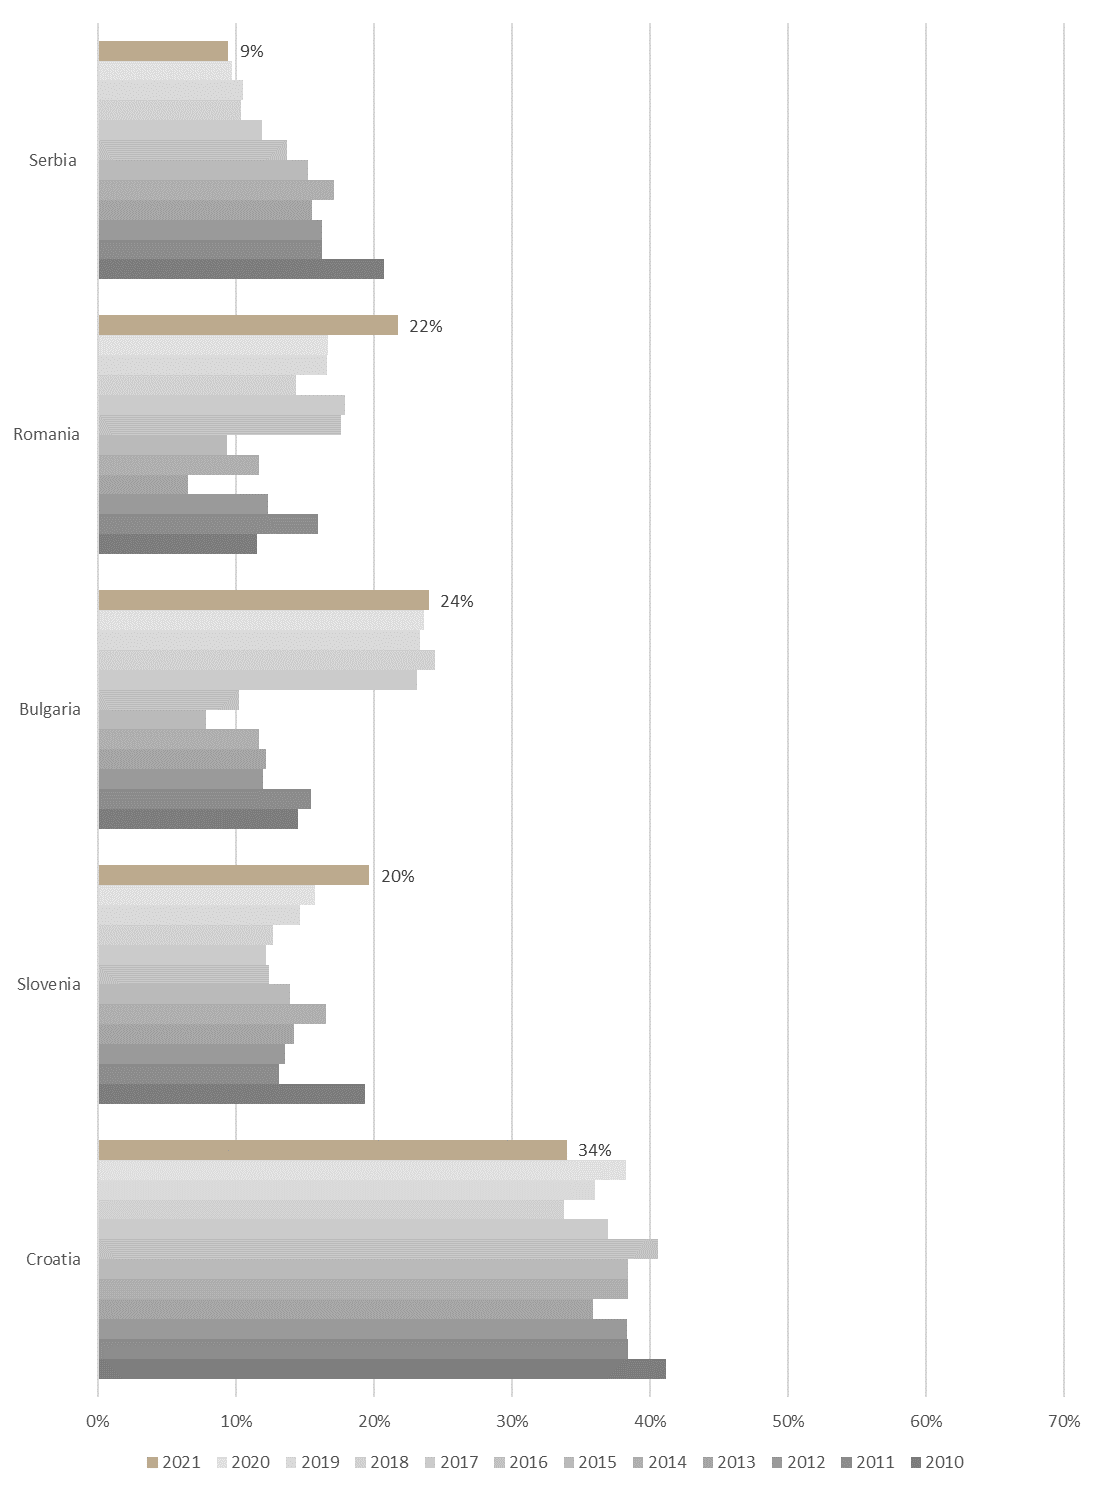
By looking at the indicators across the region, we could conclude that the Croatian market is the most expensive one, but due to legislation that was in force at the time, Croatia has many companies listed on the stock exchange and annually there are more delistings of shares than capital increases and listing together. So comparing the whole market cap to GDP can give quite a distorted picture – therefore, we should take this ratio in Croatia with a grain of salt, as the “real” ratio is much lower. We will address the “normalized” Buffet ratio for Croatia at the bottom of this blog. Nevertheless, current changes in this ratio can give us useful information. We can clearly notice the decline in this ratio in Croatia in 2021. This decline happened as market capitalization witnessed a slight increase of 1%, while real GDP surged by 11% YoY. As a result, we can conclude the Croatian market capitalization did get “less” expensive in relation to real GDP – produced goods and services in Croatia.
In 2021 Buffet ratio in Slovenia increased by 4 p.p. This increase happened as total market capitalization in Slovenia surged YoY (+33%) – while GDP reported a solid growth rate of app. 6%. As the numerator in the ratio (market cap) increased more than the denominator (GDP), the ratio went up. From this, we would conclude that Slovenian stocks on aggregate level became “more” expensive in relation to real GDP – produced goods and services in Slovenia.
Buffet’s ratio in Serbia continued the decline. In the last decade, this ratio fell due to an overall decrease in market capitalization. This year it decreased again, but the reason why the ratio is different is that in 2021 market cap increased, but the increase in real GDP was higher, thus the ratio fell. The conclusion about the market in Serbia is that companies are not so “expensive” in relation to real GDP – produced goods and services in the country.
As previously said, Croatia has many companies listed on the stock exchange and annually there are more delistings of shares than capital increases and listing together. Even though the first 20 most traded stocks make up 85% of total yearly stock turnover, their market capitalization makes up only 50% of the total market capitalization of all listed companies meaning that a lot of market capitalization is not traded on the regular market. For example, Slovenia has a completely different picture – on Ljubljana Stock Exchange, the most traded 20 stocks make up almost all volume traded and all market capitalization on the market. Therefore, we decided to “normalize” the buffet ratio for Croatia, as we could come to the conclusion that Croatia is “the most expensive” country within the region. The argument for our normalization of this ratio is based on the fact that many companies on ZSE have almost non-existing turnover. Due to the above-said statements, we decided to look at the Buffet ratio, but focus only on the market capitalization of actually traded companies, and compare it to the Buffet ratio we would get if we go “by the book”.
As it can be seen from the chart above, the normalized Buffet ratio and “by the book” ratio are not completely correlated, as the normalized Buffet ratio grows in 2021 while the standard Buffet ratio declines. We can see that Croatia’s normalized Buffet ratio is now more comparable to regional markets. In Slovenia and Romania in 2020 Buffet ratio stood at 16% and 17% respectively while in Croatia the normalized Buffet ratio stood at 13.5%. In 2021 in Slovenia and Romania it grew 4 p.p. and 5 p.p., respectively but in Croatia only by 3.4 p.p. to app. 17%. So when looking from that standpoint we can say that Croatian companies on the stock market are not that expensive in relation to the real economic output. And looking at Croatia compared to last year, the company’s market capitalization did not get “less” expensive in relation to real GDP, but when you compare them to regional countries they are more affordable.
The Bucharest Stock Exchange published its FY 2021 results on Friday, showing a 9% increase in revenue, a 29% decrease in EBITDA, and a 19.8% decrease in net profit.
The Bucharest Stock Exchange published its preliminary FY 2021 results on Friday, showing an increase of 9% (or RON 3.87m) in sales revenue. When breaking the revenue down by segments, revenue from the trading services increased by 2.76% YoY (or RON 700.3k), due to fixed taxes revenue increase. At the same time, revenues related to the post-trading services (DC) increased by 21% YoY (or RON 2.27m), due to an increase in revenues from admission and maintenance participants, as well as an increase in commission for maintaining the participant quality, and an increased of the value of portfolio managed by the custodians. Meanwhile, the CCP.RO segment did not record any sales revenue, whilst having operating expenses of RON 7.3m.
EBITDA decreased by 29.1% (or RON 3m), on the back of the high operating expenses driven by higher salary costs, which were again driven by rising labor costs in the market, as well as the other operating expenses growth, which increased by 20.7% (or RON 2.29m). At the same time, net financial revenues recorded an increase of 97% YoY (increasing from RON 1.89m to RON 3.72m), because of a gain from unrealized exchange rate differences from the revaluation of financial instruments in foreign currency.
The Group’s net profit decreased by 19.8% YoY in 2021, dropping from RON 6.26m to RON 5.02m, due to the decrease in the operating result (which was partially offset by the positive evolution of the financial result).
When looking at the stock exchange’s KPIs (Key Operating Indicators), as of the end of 2021, the total market capitalization of all the listed companies (Regulated and AeRO markets combined) amounted to RON 160bn, an equivalent of EUR 32.35bn. The total traded value exceeded RON 20bn (EUR 4bn) for the 1st time in BVB’s history. This would also amount to a daily turnover of RON 79.4m (EUR 16.1m), while the main indices BET and BET-TR increased by 33% and 40% in 2021, respectively.
As of the end of December 2021, the total deposits in Croatia amounted to HRK 365.8bn, representing an 11.1% growth in 2021.
Croatian National Bank [HNB] has published the consolidated statement of financial position for the monetary financial institutions for December 2021, in effect, giving us an overview for the entire year. As of the end of December, the total deposits in Croatia amounted to HRK 365.8bn, which is an increase of 11.1% over the course of the year, and 0.5% MoM. This means that as of the end of 2021, the Croatian deposits are again at an all-time high, continuing the positive trend they have experienced.
Looking over to the components of this growth, the largest contributor was the demand deposits, which grew by 21.1% in 2021, reaching HRK 152.9bn, and accounting for 41.8% of total deposits. At the same time, saving deposits grew by 4.8% in 2021, amounting to HRK 212.9bn, whilst having a slight decrease of -0.3% MoM. Looking at the saving deposits by type (in HRK and foreign currency), the deposits in HRK decreased by -1.8% YoY, -0.2% MoM, reaching HRK 30.7bn.
Meanwhile, foreign currency deposits grew by 6% YoY and decreased by -0.3% MoM, reaching HRK 182.2bn in 2021. This means that domestic currency saving deposits account for 14.4% of all saving deposits, whilst foreign currency accounts for the remaining 85.6%. Foreign currency deposits were always popular in Croatia due to their recent history of high inflation and change in currencies after Croatia became independent in 1991. Share of FX deposits has been increasing as Croatia is approaching introduction of Euro that is expected from 1 Jan 2023, at the fixed rate of EURHRK 7.53450. In the last two years share of FX deposits in total deposits has increased by 2 p.p. As a comparison, at the end of 1995, share of FX deposits accounted for 87% of total deposits, which were more than 10x smaller and stood at HRK 16.3bn.
When looking at the household deposits by themselves, we can see that they grew by 9.6% in 2021, amounting to HRK 246.1bn in December. This would also mean that 67.27% of all deposits held were household deposits, which is an increase of 28 bps MoM, and a decrease of 90 bps YoY.
Deposits breakdown (HRK bn)