The European Central Bank cut its deposit facility rate by 10bp to -0.50% and relaunched a sizable APP at its meeting yesterday. The market reaction was mixed – EURUSD dropped to YTD low during the press conference, but rallied strongly in the aftermath, possibly due to closing of the speculative short term positions.
Mario Draghi managed once again to reconcile opposing fractions within the ECB’s Governing Council and delivered what is generally considered a strong stimulus package. The deposit facility rate was cut by 10bps, as expected, but the dovish part starts with the introduction of deposit tiering designed to offset part of the ”parking costs”. About 800b EUR out of the 1.8 trillion EUR of excess reserves would be exempt from -0.50%, but this is just the starters and might be increased down the road.
The Governing Council also decided to reintroduce QE in size of 20b EUR/month, which is 10b EUR less than the market expected. On the other hand, asset purchases are designed to be open ended, which is the reason why one of the journalists on the press conference dubbed it “QE ad infinitum”. Open ended QE is probably going to run into bottlenecks stemming from capital keys and issuer limits, and removing these obstacles might be more difficult than some think. This is not the only thing that’s left open ended – the calendar date of forward guidance has been scrapped (no “middle of 2020” mentioned) and instead a more data dependent wording was introduced, stating that lower rates would remain until “inflation outlook robustly converge to a level sufficiently close to, but below, 2% within the projection horizon, and such convergence has been consistently reflected in underlying inflation dynamic”. With current deflationary environment, nursed by demographic aging, dropping PPIs in China, trade wars etc., accommodative monetary measures might stay with us for a longer time than some of the core central bank governors think. Bond markets zig-zagged with Bund yield first dropping to -0.64%, but then staging a strong reversal and rising all the way up to -0.496%, the level seen for the last time in the beginning of August. Equities rallied as well, but some of the price effect on share prices came from the direction of conciliatory trade talk between US and China, which is exactly the story that financial markets would be focused on today. The next big date on the global central bank calendar would be next Wednesday (September 18th) when markets expect FED Chairman Powell to deliver new rate cut.
Today we decided to update performances of the regional, frontier and emerging market indices in order to put CROBEX’s performance from the beginning of the year into perspective. Furthermore, we compared the historical movement of CROBEX performance to “fear index” VIX in order to analyse whether the domestic index follows global sentiment.
The VIX index has shown positive development during this year by decreasing as much as 44% since the beginning of the year. Initially the index reached its yearly high at the beginning of the year when it amounted to a value of 24.45. Afterwards the index went on to have a mixed performance but mostly directed downwards. Note that VIX is calculated based on the S&P 500 options and reflects market expectations on volatility in the coming 30 days. Unlike classic indices, VIX’ growth represents negative sentiment or increased risk of market volatility. VIX levels over 30 are considered risky and suggest a decline in share prices.
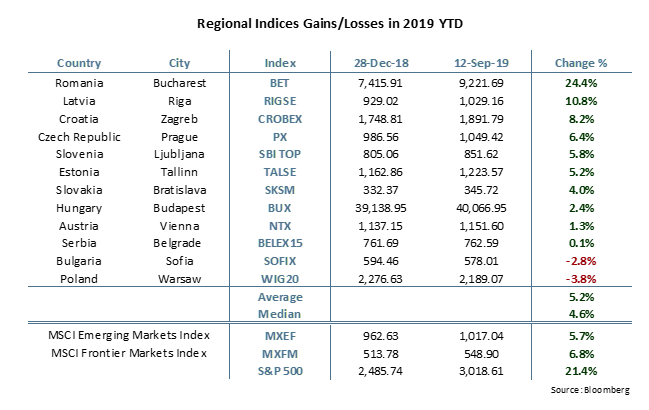
Turning our attention to the region, almost all indices posted a solid YTD performance with the average value growth amounting to 5.2%. The Romanian BET index recorded a 24.4% YTD increase in value which makes it by far the best performing index in the region. Afterwards come the Latvian RIGSE (10.8%) and the Croatian CROBEX (8.2%). On the flip side the Bulgarian SOFIX index and the Polish WIG20 were the only indices to end the observed period in the red by posting a decrease in value of -2.8% and -3.8% YTD, respectively.
In August 2019, GWPs rose by 5.7% compared to last year. GWPs in non-life insurances grew 9.1% YoY, while life insurance decreased -1.7% YoY.
In August 2019, GWP’s rose by 5.7% compared to the same period last year. The total amount of GWPs collected reached HRK 7.4bn (includes insurers located in Croatia and insurers operating in Croatia but based in another EU country).
Total Croatian T12 GWP and Croatia Osiguranje T12 GWP (HRK bn)
The amount of GWPs in non-life insurances, which traditionally account for the biggest portion, grew 9.1% YoY, amounting to HRK 5.2bn. Meanwhile, life insurance continued with a trend where more maturities than premiums contracted were observed so segment has realized a decrease of -1.7% YoY, reaching HRK 2.2bn.
Croatia Osiguranje accounted for 27.9% of the market, as the company’s market share decreased by 2pp which is slow-down of a decreasing trend as in July market share has decreased for 2.5pp. When looking at at GWP in the last 12 months Croatia Osiguranje market share has increased to 26.2% from 26% in July. When observing their GWPs in August, they amounted to HRK 2.1bn, which represents a decrease of 1.5% YoY.
Croatia Osiguranje T12 Market Share (%)