US February CPI release and ECB’s monetary policy meeting were two most important events this week. It seems both events reversed some of rate sell-off that we have seen for the last few weeks. US CPI for February landed right at the expectations while ECB announced it will step up its PEPP purchases.
One of the most scrutinized trades this year has been reflation trade. As economy in US is opening at a faster pace than previously considered and US government seems to be eager to propel demand to the sky investors started to worry whether inflation could rise significantly. In February this was still not the case as data showed that CPI stood at 1.7% YoY (versus 1.4% in January), exactly the level analysts expected. Obviously, headline inflation was driven by rise of energy prices which rose by 3.9% MoM. However, core inflation stood at ‘only’ 1.3% YoY, reflecting decrease from 1.6% and 1.4% in December 2020 and January 2021, respectively. It is clear that base effects of corona still did not kick in as economy and prices witnessed sharp drop only in March last year so effect should be much stronger next month. Furthermore, US vaccination process accelerates while corona cases are falling rapidly, meaning that some of the states could start opening completely as Texas already did last week. Oil prices being almost double compared to the levels seen last year in March, giant savings, fiscal stimulus of USD 1.9tr are only some of the factors that should ensure inflation in US to jump above 2.0% at least and we would not exclude above 3.0% levels. At the same time, we could see core inflation rising also, driven by service sector.
Source: Bloomberg, InterCapital
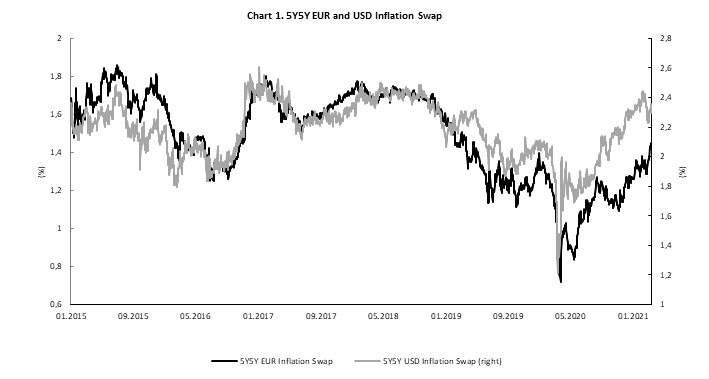
Talking about inflation, one could not look at the yields that are the hottest theme right now among investors and analysts. February CPI of 1.7% did not surprise investors as expectations stood at 1.7% and result was slight fall in yields showing that investors were prepared for slightly higher CPI level. US 10Y treasury yield fell from 1.60% levels to 1.55% after the press release and fell further below 1.50% yesterday before ECB’s meeting.
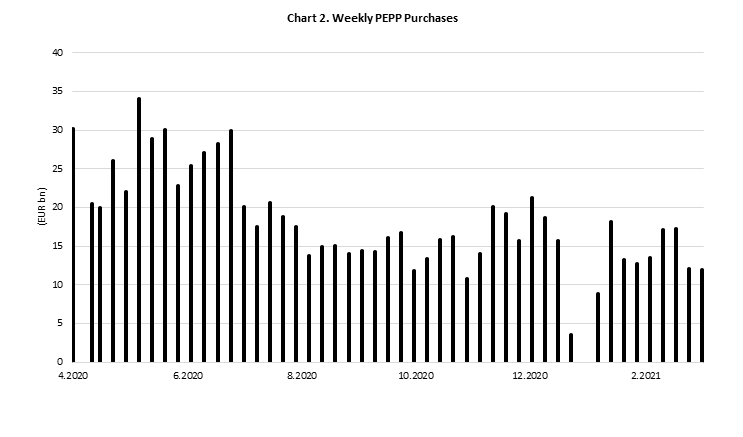
On the other hand, ECB did manage to surprise investors, after announcing that “the Governing Council expects purchases under the PEPP over the next quarter to be conducted at a significantly higher pace than during the first months of the year”. It seems market expected ECB only to talk about the flexibility of its PEPP buying rather than putting this into statement which is a confirmation of their dovishness that was questioned in the last few weeks after some mixed messages from ECB officials. In all the other parts, ECB’s statement was the same as last month, leaving rates unchanged, highlighting their favorable TLRO III, APP and saying that PEPP envelope could be enlarged if needed. After the statement, Ms Lagarde said that ECB does not have any particular number in mind in respect of “significantly higher pace..” leaving central bank with much flexibility although there were some questions on the market whether this was only talk once again. Last few weeks we have seen some verbal intervention from ECB’s officials although PEPP data showed that they did not increase their weekly buying. However, in the next following months situation should be different (not to derail their credibility) which should be visible in their weekly PEPP, but first increased buying should be seen only next Monday (March 22nd).
In any case, yesterday’s ECB statement shows that ECB is firm in their intention to keep yield curves lower for longer using its PEPP envelope which could of course be enlarged in case needed, although they do not want to name it yield curve control. Looking at the economic performance in euro area and US, it is clear that ECB’s decision was rather reasonable as GDP gap seems to be quite bigger on this side of the Atlantic while vaccine process is nowhere near US. Furthermore, fiscal policies are quite different which is most likely to result in much larger inflation in US, while in eurozone inflation could be only transitory which was one of the statements by Ms Lagarde.
Source: ECB, InterCapital
As of end 2020, market cap to GDP for Croatia stood at 39%, while for Slovenia it stood at 15.1%.
We made a brief analysis of the total market capitalization of listed companies as a % of GDP for Croatia & Slovenia. The historic GDP data was taken from the Croatian bureau of statistics and Statistical Office of the Republic of Slovenia latest available publications. Market caps were taken from the statistics published by regional stock exchanges.
The market cap to GDP ratio, or the Buffet Indicator as it is sometimes referred to, since it was popularized by the famous investor Warren Buffet, compares the market capitalization of all publicly traded stocks on a single market with the country’s GDP. It was one of the indicators of the approaching storm and later the crises in 2008, which severely damaged the equity markets. As Buffett said, “The ratio has certain limitations in telling you what you need to know. Still, it is probably the best single measure of where valuations stand at any given moment”. Therefore, the metric is often used to determine whether the stock is over or undervalued.
Highest ratio can be seen in 2007 right before the housing crisis. However, after the financial crisis struck, one can notice that the ratio declined substantially as we were witnessing a lot of companies initiating squeeze out and delisting procedures. Since than, market cap to GDP never reached such high levels both in Croatia and in Slovenia. With the recent GDP announcement, it is worth revisiting Buffet’s indicator to see how the pandemic changed the ratio in both Croatia and Slovenia.
Croatia’s Market Cap / GDP
By the end 2020, the equity market cap of ZSE dropped by 7.2%, to HRK 137.4bn. Meanwhile, 2020 also brought about the deepest economic contraction in Croatia since 2009, with GDP decreasing by 8.4% YoY. As a result, as of end 2020 market cap to GDP slightly increased to 38.98%. However, if we were to look at free float market cap to GDP we would observe a relatively low ratio of 15.7%.
Slovenia was relatively less affected by the pandemic Covid-19 with the economy contracting by 5.5% in 2020. Meanwhile, Slovenian blue chips showed strong resilience to the pandemic with the equity market cap of LJSE decreasing by only 2.1%. Consequently, market cap to GDP as of end 2020 stood at a very low 15.1%.
Although one should never look at a single parameter when determining whether a market is under or overvalued, it seems that the according to Buffet’s indicator both countries might have plenty of room for growth in equities.
Slovenia’s Market Cap / GDP
In 2020, Intereuropa reported a decrease in sales of 6%, EBITDA of 12% and net profit of 15%.
In 2020, Intereuropa recorded sales of EUR 150.7m which is a decrease of 6% YoY. Such a result exceeded the company’s expectations by 8% with sales above the planned figures in all three business lines, in absolute terms the highest sales revenue figures was realized in land transport. Despite the extremely adverse business conditions in all markets, the Group managed to ensure continuous logistical support to customers along the entire supply chain, both during the first and second wave of the epidemic. Sales were driven by land transport which is the biggest component of Group’s revenue. We note that the most significant decline in the sales revenue of the Group in 2020 was recorded by the parent company and the Montenegrin subsidiary.
EBITDA decreased by 12% on YoY basis but it is 21% over planned EBITDA. The decrease of EBITDA was expected due to decrease of sales as well as higher labour costs and average labour cost than in 2019. Still, it was positively impacted by lower other operating expenses in 2020 in conjunction with other operating revenue that increased by EUR 0.6m. It was mostly the result of higher revenues coming from the reversal of non-current provisions in the amount of EUR 0.3m.
Additionally, Intereuropa’s operating profit decreased by 23% to EUR 5.8m. In 2019 major one-time revenues from the repayment of disputed operating receivables occurred, which was not evidenced in 2020. Nevertheless, Intereuropa exceeded Management’s expectations by 120% as EBIT was planned at EUR 3.14m.
Going further down the P&L, Intereuropa’s bottom line decreased by 15% YoY. Such a result shows a slight deterioration of profit margin by 0.3 p.p. to 2.4%.
Turning our attention to indebtedness, Intereuropa reduced their debt by EUR 10m in 2020, to EUR 44.4m. The reduction of debt improved their net debt to EBITDA ratio to 3.6x in 2020 (-7.3% YoY). The parent company concluded the annex of the loan with syndicate of banks in May 2020 in order to mitigate the effects of the COVID-19 epidemic and to strengthen the company’s liquidity position. The payment of the principal and interest for one year was deferred, so finance costs for interest in 2020 also decreased by EUR 1.0m or 54%. The investments of the Group were down 27% to EUR 2.1m. Of that amount, EUR 0.6m was invested in real estate and EUR 1.5m in equipment and intangible assets.