After receiving the latest CPI print for the US the most natural question one would ask is are the ECB and the FOMC still going to move in sidestep or are they embarking on different paths when their cutting cycle begins which was widely expected to be from June meetings for both central banks. What does this CPI print mean for the ECB and what kind of posture will they take? – Here is our view:
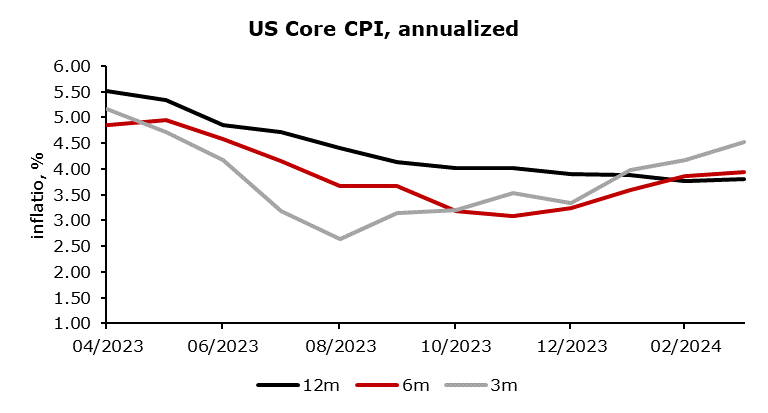
The US economy won’t be alleviated from the burden of higher inflation anytime soon as it was widely expected, at least that is what the newest CPI figures suggest. Consumer prices rose by 0.4% in March compared with the previous month and 3.5% on a year-on-year basis. When looking at the more significant core rate, excluding volatile energy and food prices, they were still up 0.4% month-over-month (which is the same number we received for January and February and not a very appropriate one if you decide to take 3m inflation and annualize it) and a whopping 3.8% year-on-year. Let’s look a bit more at specific drivers of inflation in the US. MoM core rate rounded to two decimal places was 0.36. Core goods are still experiencing an encouraging trend (-0.1% MoM) while core services don’t show any signs of flagging (+0.5%). Housing and OER (Owners’ equivalent rent) rates of growth remained high and some other components that experienced higher rates are car insurance, car repairs, and hospital & related services.
Source: Bloomberg, InterCapital
This US inflation print for March is likely to stir up views of FOMC members about rate cuts. At their latest meeting we received an update to their Summary of Economic Projections (SEP) which contains the popular dot plot in which members express their current assessment of the year-end Federal Fund Rate for this and following 3 years along with longer run projection. The median dot was expecting 3 cuts this year and it took only one person to lower their assessment so that the median dot would show only 2 cuts this year. Latest comments from chairman Powell assured the market that a cut in June would be imminent after receiving a couple more months of good data. The market has taken this CPI print as a bellwether suggesting that FOMC might have to shun the June meeting as the one for the first rate cut. Before receiving this CPI print, the market was pricing 2.65 cuts by the end of the year, and the June cut was priced in with a 60% probability. The situation is a little bit different today with the market pricing 1.65 cuts by the end of the year and a cut at the June meeting is now viewed as a 19% probability event.
Source: Bloomberg, InterCapital
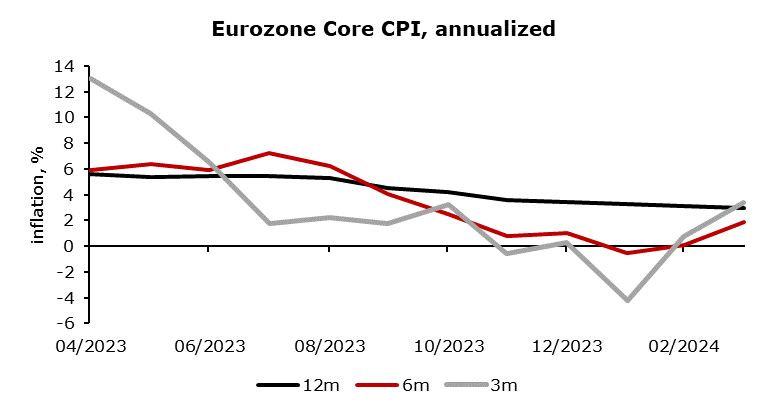
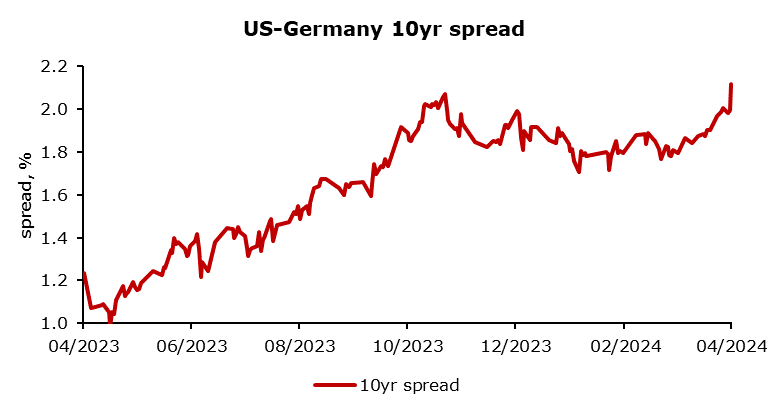
Pricing for ECB hasn’t changed a bit, June cut is still priced in with a probability of 81% and the market is still expecting 3 cuts this year. Inflation and growth figures for the US and the EU in the past couple of months show a clear disparity in trends which has led to a widening of the US-Germany 10yr spread. Some have questioned the willingness of the ECB to start their cutting cycle before the Fed because of fears of the EUR/USD foreign exchange rate sliding towards parity and aggravating EU terms of trade. In our opinion, angst about that is still premature with EUR/USD being currently at 1.075. We know what our afternoon pastime is going to be. – We are receiving another set of PPI figures which should clarify the picture regarding US inflation and 15 minutes later at CEST 14:45 ECB presser takes place in which President Lagarde should provide us with information solidifying ECB’s stance on rate cuts.
Source: Bloomberg, InterCapital
Today, we present you with further DuPont decomposition of selected Croatian Blue Chips by looking into interest and tax burden and comparing it with their peers.
Since the beginning of the week, we looked at two components of 5-step DuPont decomposition of ROE: operating margin, financial leverage and asset turnover. You can read about it here. Today, we present you with the last two components of DuPont decomposition of the selected Croatian Blue Chips. Today we will look at the interest burden and tax burden. These components highlight how much do tax and interest weigh down a company’s net profitability. These two components, along with the discussed operating margin, are just an extension of the net profit margin calculation to give us detailed information about the impact of operating activity, interest and tax effect on the net profit margin of the company.
We should note that both interest and tax burden are calculated using P&L operating level and under, meaning they can more often be under the impact of “one-offs”.
Interest burden tells us the extent to how much the net financial result of the company together with profit from associates (20-50% shareholding) and investments (<20% share) impacts its profit. If a company pays more interest on its debt than what it receives as interest from its loans or profits from its investments into associates or joint ventures, this ratio will fall below 1, meaning that net financial & investment result have impacted its profit negatively. It is calculated as EBT divided by EBIT.
Tax burden gives us a proportion of profits retained after tax. This indicates how much tax impacts a company’s bottom line. It is calculated as a company’s bottom line, net profit, divided by EBT, pre-tax income. If a company has to pay in the observed period, this ratio will naturally fall below 1, dragging a company’s profitability downwards.
Interest burden – Croatian Blue Chips [FY 2023]
Source: Bloomberg, InterCapital Research
As can be seen from the graph above, the interest burden of all Croatian blue chips closely follow the industry mean, which should not come as a surprise. This is just a result of a similar capital structure within the same industry. Within the valuation context, this leads to a similar weighted average cost of capital (WACC), due to more similar capital and debt weights. Also, the reported situation can be partly explained due to companies operating in the same region and generating sales from a similar region. This leads to similar FX gains/losses, which are also affected by the company’s risk management and hedging strategy.
Nevertheless, Končar reported an interest burden of 1.12 as its EBT (EUR 88.8m) was higher than EBIT (EUR 79.3). The reported interest burden higher of 1, by itself, indicates a positive net financial & investment result. Končar reported just a slightly negative net financial result of EUR 385k. However, Končar has a joint venture with Siemens, Končar-Power Transformers Ltd. (Končar – Energetski transformatori d.o.o., Zagreb) where it has a shareholding of 49%. This company was very profitable in this FY and Končar’s share of profit has amounted to EUR 9m. Each other taken blue chip has an interest burden amounting to <1.
Tax burden – Croatian Blue Chips [FY 2023]
Source: Bloomberg, InterCapital Research
As can be seen from the graph above, the tax burden of all Croatian blue chips closely follows the industry mean, which should also not come as a surprise. Tax burden indicates how much does tax impacts a company’s bottom line. If any of the blue chips reported significant deviation from the industry mean, it would probably be due to some “one-offs”, for example, a tax incentive. Valamar Riviera reported exactly the above-stated scenario. Valamar reported income tax in the amount of EUR -227k as a result of the recognition of deferred tax in the amount of EUR -3.1m and current tax of EUR 2.9m, resulting in just a slight deviation in EBT and Net profit. Consequently, the Group’s tax burden amounted to 1x. Finally, Podravka’s tax burden amounted to >1 on the back of the positive income tax amounting to EUR 11.3m due to tax incentives based on the Investment Promotion Act.
Tomorrow we will elaborate the impact of all five decomposed components on Croatian Blue Chip’s Return on equity (ROE) and compare the whole picture given by DuPont within the industry context.
At the price before the announcement, this would amount to a dividend yield of 7.5%. The ex-date is set for 16 April 2024.
During its General Assembly meeting held yesterday, 10 April 2024, ZABA approved the proposal for the distribution of profit from the year 2023. This would amount to a dividend of EUR 1.4 per share, representing a DY of 7.5%.
However, we note that the ex-date is set for 16 April 2024 instead of the initially proposed 17 April 2024, as that will be a non-working day in Croatia due to the elections. The record date is set for 18 April 2022, and the payment date is set for 13 May 2024. Below we provide you with the historical overview of the dividend per share and dividend yield movements.
ZABA dividend per share (EUR) & dividend yield (%) (2012 – 2024)
Source: ZABA, InterCapital Research