Index performance wise, 9M 2020 could be characterized as a quite challenging period for all regional markets. How does this performance compare to the previous years?
In 9M 2020, all indices observed a decrease of their respective main index, which can be seen in the graph below. Slovenian market observed the lowest index decrease of 8.6%, which could be attributed to a very solid share price performance of Krka, which takes up almost a third of the index.
Performance of Regional Indices in 9M 2020
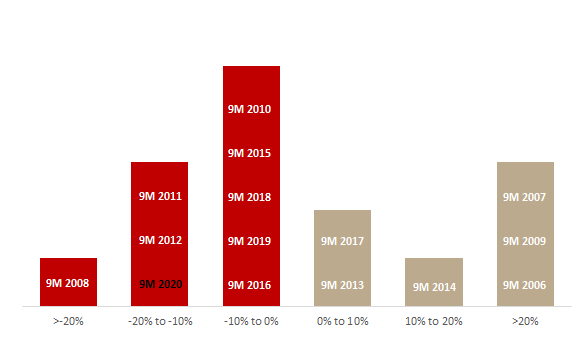
The following graphs show 9M return of each index on a spectrum from >-20% to >+20%. Note that the higher placement of a certain period on a graph represents a better (gold) or worse (red) index performance in the respective period.
CROBEX (9M 2003 – 9M 2020)
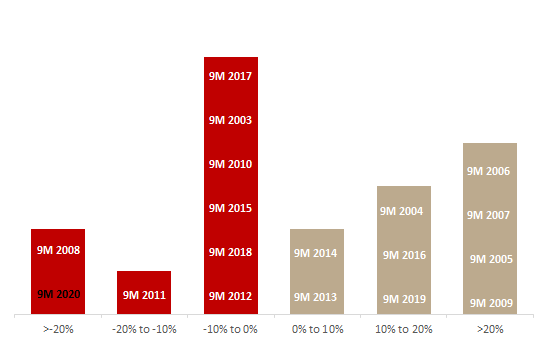
Source: Bloomberg, InterCapital Research
SBITOP (9M 2004 – 9M 2020)
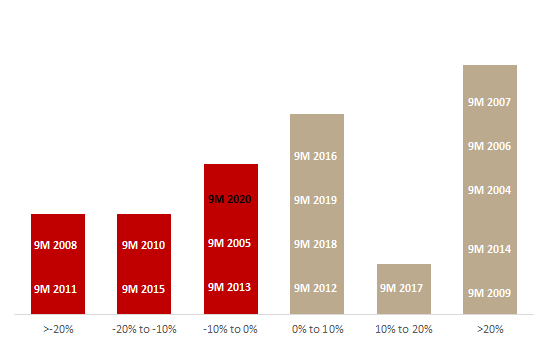
Source: Bloomberg, InterCapital Research
BET (9M 1998 – 9M 2020)

Source: Bloomberg, InterCapital Research
BELEX15 (9M 2007 – 9M 2020)
Source: Bloomberg, InterCapital Research