Today we decided to update performances of the regional, frontier and emerging market indices in order to put CROBEX’s performance from the beginning of the year into perspective. Furthermore, we compared the historical movement of CROBEX performance to “fear index” VIX in order to analyse whether the domestic index follows global sentiment.
The VIX index has shown positive development during this year by decreasing as much as 44% since the beginning of the year. Initially the index reached its yearly high at the beginning of the year when it amounted to a value of 24.45. Afterwards the index went on to have a mixed performance but mostly directed downwards. Note that VIX is calculated based on the S&P 500 options and reflects market expectations on volatility in the coming 30 days. Unlike classic indices, VIX’ growth represents negative sentiment or increased risk of market volatility. VIX levels over 30 are considered risky and suggest a decline in share prices.
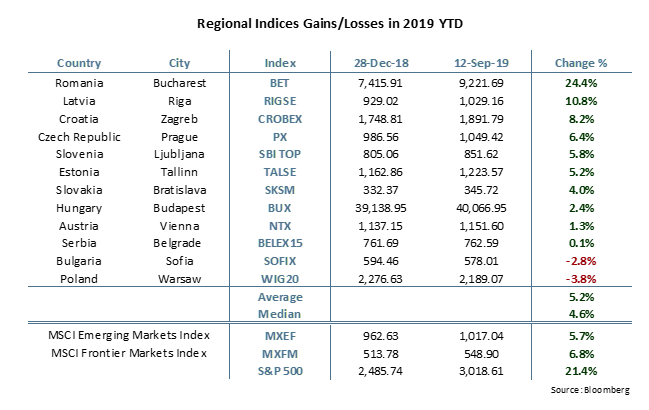
Turning our attention to the region, almost all indices posted a solid YTD performance with the average value growth amounting to 5.2%. The Romanian BET index recorded a 24.4% YTD increase in value which makes it by far the best performing index in the region. Afterwards come the Latvian RIGSE (10.8%) and the Croatian CROBEX (8.2%). On the flip side the Bulgarian SOFIX index and the Polish WIG20 were the only indices to end the observed period in the red by posting a decrease in value of -2.8% and -3.8% YTD, respectively.