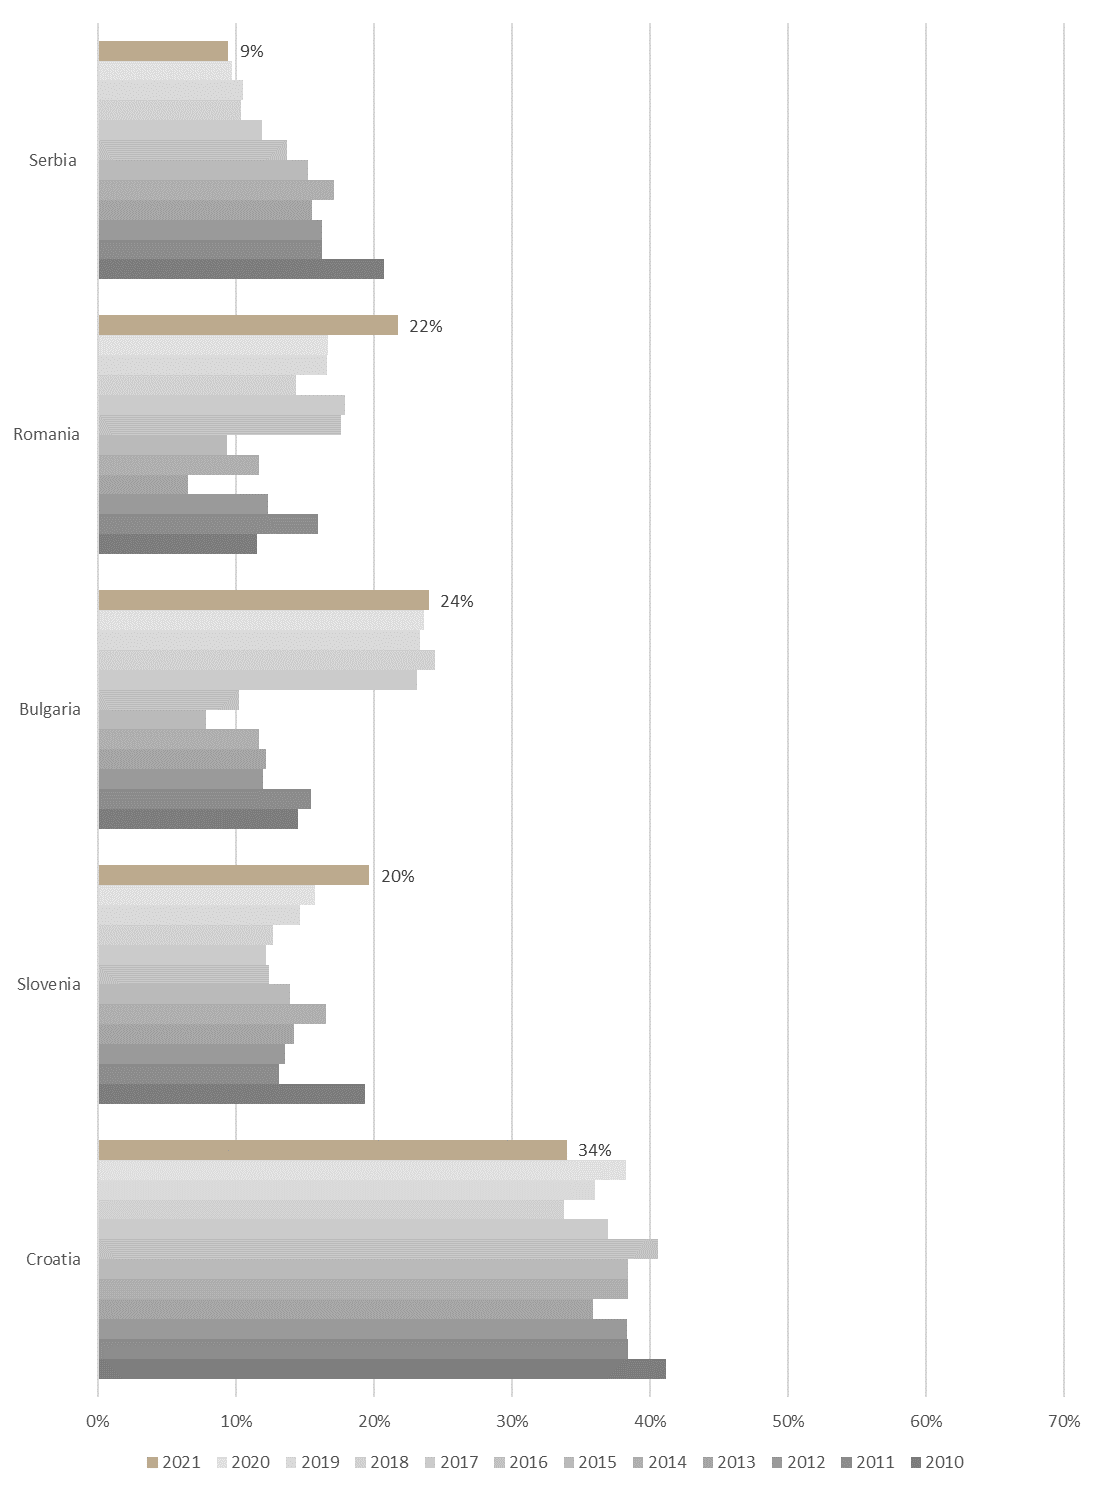
As 2021 has ended, we bring you a brief analysis of the total market capitalization of listed companies as a % of GDP in countries from the region – also known as Buffet’s indicator.
The market cap to GDP ratio, or the Buffet Indicator as it is sometimes referred to, due to the fact that it was popularized by the famous investor Warren Buffet, compares the market capitalization of all publicly-traded stocks on a single market with the country’s GDP.
This ratio compares the “price” of the companies on capital markets (prices include positive expectations, thus increasing market capitalization) and the real economy: produced goods and services within the country. The logic that lies within this ratio should give us rough aggregate pricing data in one country. The higher the ratio is, the more “expensive” companies on the capital market are, compared to the real economy. The ratio could be higher by increasing the market capitalization of companies or if a sharp decline in GDP occurs, without decreasing in market capitalization.
It was one of the indicators of the approaching storm and later the crises in 2008, which severely damaged the equity markets. As Buffett said, “The ratio has certain limitations in telling you what you need to know. Still, it is probably the best single measure of where valuations stand at any given moment” so it is often used to determine whether the stock market is overvalued or undervalued.
By looking at the indicators across the region, we could conclude that the Croatian market is the most expensive one, but due to legislation that was in force at the time, Croatia has many companies listed on the stock exchange and annually there are more delistings of shares than capital increases and listing together. So comparing the whole market cap to GDP can give quite a distorted picture – therefore, we should take this ratio in Croatia with a grain of salt, as the “real” ratio is much lower. We will address the “normalized” Buffet ratio for Croatia at the bottom of this blog. Nevertheless, current changes in this ratio can give us useful information. We can clearly notice the decline in this ratio in Croatia in 2021. This decline happened as market capitalization witnessed a slight increase of 1%, while real GDP surged by 11% YoY. As a result, we can conclude the Croatian market capitalization did get “less” expensive in relation to real GDP – produced goods and services in Croatia.
In 2021 Buffet ratio in Slovenia increased by 4 p.p. This increase happened as total market capitalization in Slovenia surged YoY (+33%) – while GDP reported a solid growth rate of app. 6%. As the numerator in the ratio (market cap) increased more than the denominator (GDP), the ratio went up. From this, we would conclude that Slovenian stocks on aggregate level became “more” expensive in relation to real GDP – produced goods and services in Slovenia.
Buffet’s ratio in Serbia continued the decline. In the last decade, this ratio fell due to an overall decrease in market capitalization. This year it decreased again, but the reason why the ratio is different is that in 2021 market cap increased, but the increase in real GDP was higher, thus the ratio fell. The conclusion about the market in Serbia is that companies are not so “expensive” in relation to real GDP – produced goods and services in the country.
As previously said, Croatia has many companies listed on the stock exchange and annually there are more delistings of shares than capital increases and listing together. Even though the first 20 most traded stocks make up 85% of total yearly stock turnover, their market capitalization makes up only 50% of the total market capitalization of all listed companies meaning that a lot of market capitalization is not traded on the regular market. For example, Slovenia has a completely different picture – on Ljubljana Stock Exchange, the most traded 20 stocks make up almost all volume traded and all market capitalization on the market. Therefore, we decided to “normalize” the buffet ratio for Croatia, as we could come to the conclusion that Croatia is “the most expensive” country within the region. The argument for our normalization of this ratio is based on the fact that many companies on ZSE have almost non-existing turnover. Due to the above-said statements, we decided to look at the Buffet ratio, but focus only on the market capitalization of actually traded companies, and compare it to the Buffet ratio we would get if we go “by the book”.
As it can be seen from the chart above, the normalized Buffet ratio and “by the book” ratio are not completely correlated, as the normalized Buffet ratio grows in 2021 while the standard Buffet ratio declines. We can see that Croatia’s normalized Buffet ratio is now more comparable to regional markets. In Slovenia and Romania in 2020 Buffet ratio stood at 16% and 17% respectively while in Croatia the normalized Buffet ratio stood at 13.5%. In 2021 in Slovenia and Romania it grew 4 p.p. and 5 p.p., respectively but in Croatia only by 3.4 p.p. to app. 17%. So when looking from that standpoint we can say that Croatian companies on the stock market are not that expensive in relation to the real economic output. And looking at Croatia compared to last year, the company’s market capitalization did not get “less” expensive in relation to real GDP, but when you compare them to regional countries they are more affordable.