Almost a month has passed since the so-called Liberation Day and the unravelling of the unexpectedly high across-the-board tariffs calculated by some mythical formulae. A couple of plot twists have happened since then, but the most striking is the current difference in the tales told by three different assets, namely S&P 500 Futures, USD Index (DXY), and Crude Oil Futures (WTI). Continue reading this brief research piece to explore the intricacies of the events that have led these assets to tell markedly different stories.
Immediately after the announcement of the tariffs on April 2, the majority of the asset classes began to price in a recession to follow after the impact of the introduced tariffs was considered likely to be devastating to the American economy and consequently to ripple across the world, as summarized by a popular adage „When America sneezes, the rest of the world catches a cold“. Crude Oil Futures tumbled in lockstep with equity indices, although it is worth noting that the 3:2:1 crack spread (3 * Crude Oil – 2 * Gasoline – 1 * Diesel) barely moved and is now around a dollar higher than a month ago. This suggests that refinery margins remained stable and that there was no significant repricing of reduced demand for refined products. Meanwhile, OPEC+ (read Saudi Arabia) decided that it is now appropriate to come to an end to quota cheaters, countries that produce more volume than they are allowed by quotas agreed in advance. Saudi Arabia has a distinct way of solving the snag of disobedience in the cartel by flooding the market with extra volumes of oil. The last full-blown price war target was Russia five years ago, and now Saudi Arabia has directed its anger towards other overproducing nations led by Kazakhstan, whose oil minister had the audacity to say that national interests take precedence over OPEC+ interests. Over the weekend, OPEC+ countries announced that the required production level in June would rise by 0.4mb/d month-over-month, and they signalled that additional hikes are likely in the upcoming months if Kazakhstan, Iraq, and other laggards do not improve compliance and fail to deliver compensation cuts. Still, even after the tumble of almost 20%, price risks remain skewed to the downside during the rest of the year as OPEC+ still has high spare capacity, and recession risks haven’t completely abated.
That was the first tale, as told by Crude Oil Futures. S&P 500, a representative of equity indices, has brushed off the recession risks and has returned to the point it held just before the announcement. Some question the health of this rally, which was been exacerbated by volatility compression and systematic strategies hitting their respective crests of negative positioning, leaving them with little choice but to start buying again. The concerns about the soundness of the rally are valid since no deals have been made yet, and the US remains embroiled in a trade war with China, with conflicting statements arriving about the intensity and frequency of talks between them. So here we notice some inconsistencies between what the crude oil and the equity indices are saying. GDP numbers added fuel to the fire by arriving below expectations, with the preliminary print for Q1 coming in at -0.3% QoQ (annualized). Concerns were eased by an upbeat Manufacturing ISM coupled with a downbeat prices index. On Friday, the payrolls report printed above expectations (with prior prints revised downward), although it remains to be seen if it was a one-off effect with a higher number of workers employed in ports and transport, which has been attributed to preparations by firms before tariffs taking place after their introduction (excluding China) was postponed for 90 days.
Our last witness is the US Dollar Index (DXY), and its narrative differs slightly from the ones we heard before. In the first couple of days after the announcement, Treasuries rallied, and the dollar’s fall ensued as the usual negative correlation effects took place. On April 9, as Trump decided to postpone the tariffs (excluding China), something strange began to happen. Treasuries started falling, their spread to German Bunds widened by more than 60bps (the largest weekly move in their yield differential), the usual correlation broke, and the Dollar plunged along with them. Concerns were raised about how the decisions are made in a pell-mell fashion, and policy surprises seem to be incessant. So, the almighty US market began to act like some emerging market country, leading to questions about the Dollar’s status of hegemony. We think that those kinds of questions are premature, but we advise investors to continuously monitor what these three assets are saying and wait for their stories to return to sync before making long-term projections.
S&P 500 Futures Contract, US Dollar Index, WTI Crude Oil Futures Contract (April 2025 – May 2025 YTD)
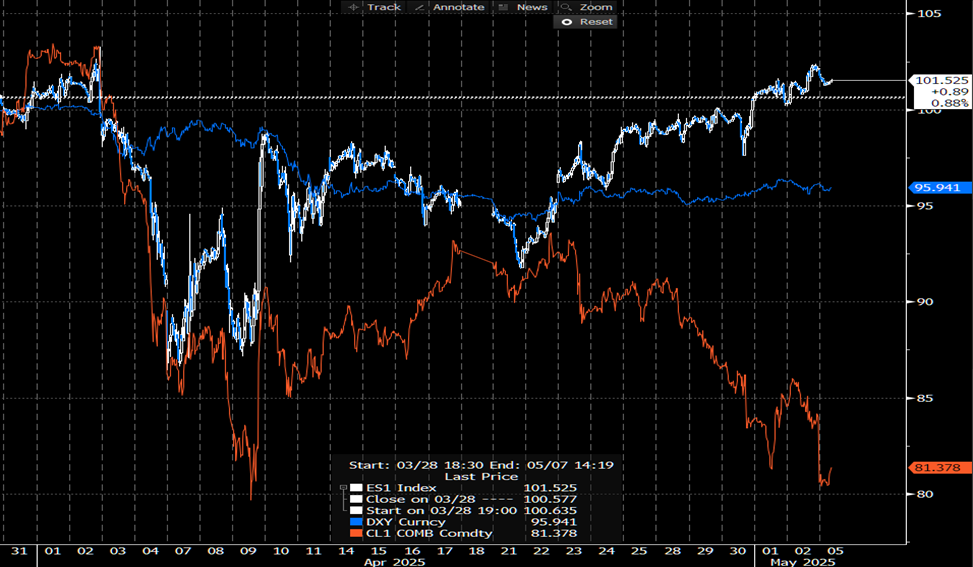
Source: Bloomberg, InterCapital Research