Have you noticed that Croatian 10Y international bond trades merely 22.1bps above the Dutch bond of equal maturity, while at the same time, France trades some 24.7bps higher in YTM. Weird, ha? Why is Croatia so expensive (or is it expensive at all)? Find out in this brief research piece.
The past couple of weeks have been quite eventful across the board of global investable assets; however, after the German-induced fiscal package (beginning March) and US-induced trade war (early April), fixed income markets have been marked by only one word – détente (as in de-escalation). A rough playbook looked like this – it’s a headline driven régime, meaning that markets trade sideways in a very narrow band until the headline comes and moves it into one direction; markets were on the edge about any possible tariff cut, that could only come through bilateral deals; and finally, we all got used to the fact that positive news from coming from President Trump could be completely reversed within hours as second party in negotiations rebuked early positive statements about trade deal being reached. Nevertheless, the size and scope of tariffs meant that the only reasonable way was simply down, i.e., they would have to be reversed and cut to a more reasonable level. Since this is pro-growth, recent weeks have been good for risky assets (S&P, NASDAQ, European equities, etc.), but bad for core fixed income.
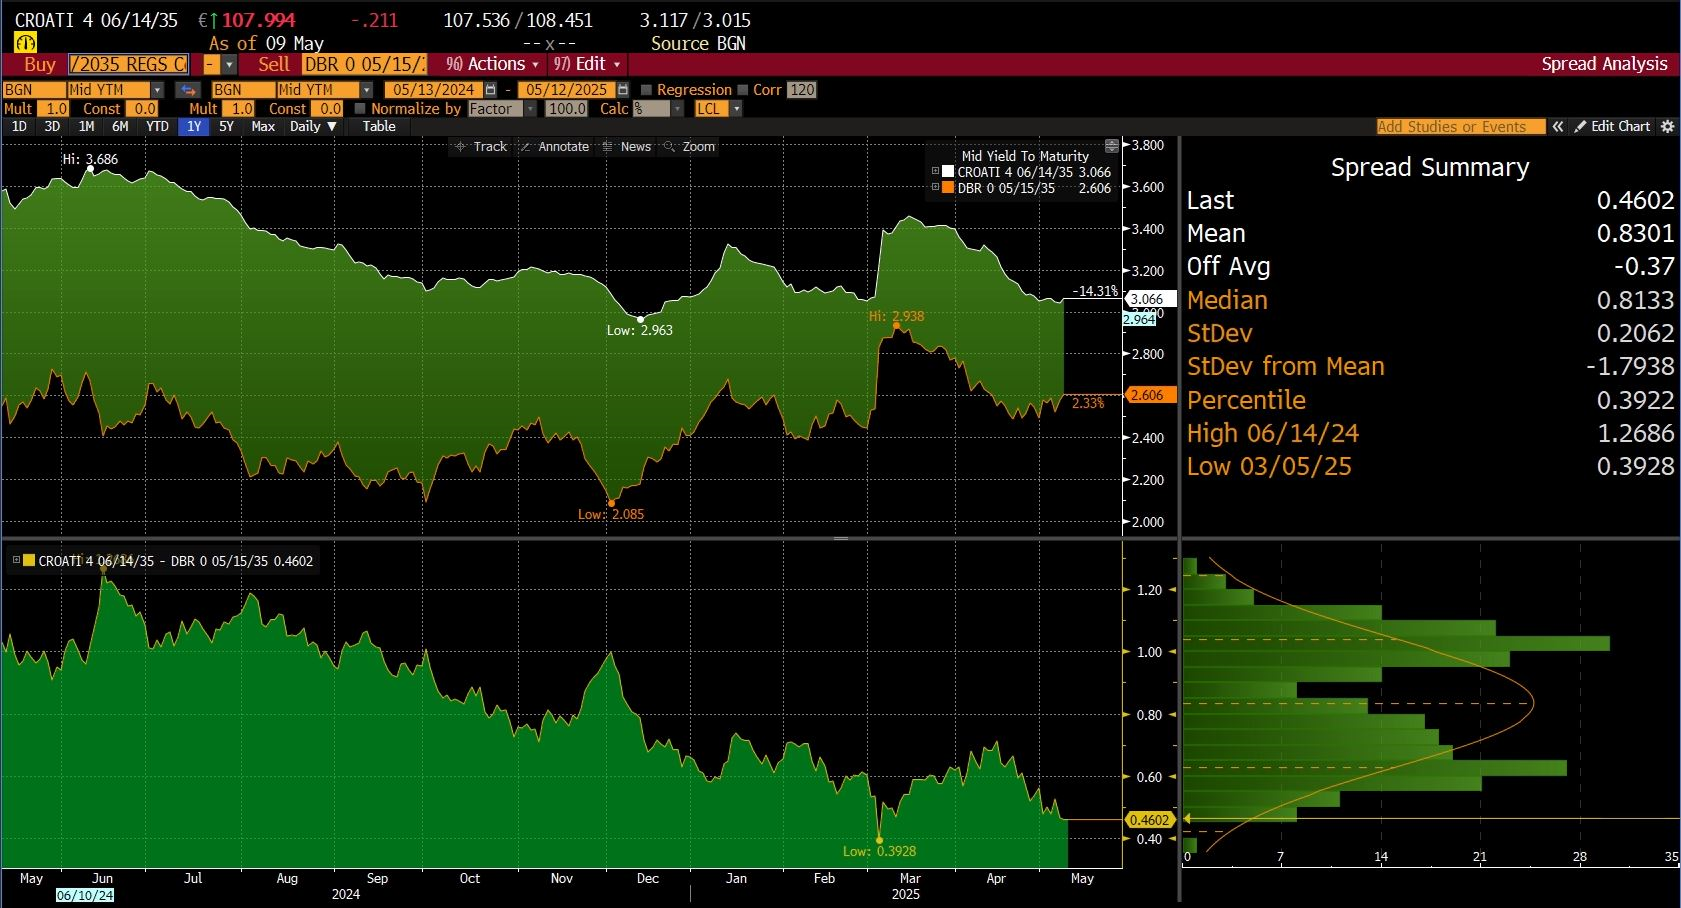
Over the past weeks, we have been frequently asked about drivers of Croatian international bond spreads, but let’s take it step by step. Strong domestic bid managed to drive CROATI 4 06/14/2035€ spread to German paper of equivalent duration, very close to all-time low at +46bps. As a matter of fact, the all-time low was printed just two months ago and was caused by a Germany-induced rise in yields, meaning that poor liquidity had an effect on the CROATI€ complex. In early May, the story is a bit different – spreads are getting tighter on solid liquidity, and seasoned traders get the story that when Croatia is tightening, it can only mean that domestic accounts are buying.
Croatian and German 10-year bond comparison
Source: Bloomberg, InterCapital
How tight is that compared to other EGBs? Here’s where things really get wild. Bloomberg GOVI function reveals that CROATI 4 06/14/2035€ now trades at +3.9bps to Austria, +12bps to Ireland, and +22.1bps to Netherlands. Moreover, the Croatian paper delivers 24.7bps lower yield than France.
10-year Croatian bond spread comparison to select EU countries

Source: Bloomberg, InterCapital
This looks odd, right? Well, yes and no. Some investors mention that the only way to get into Croatia is to buy an international placement, and although Croatia has a nominal GDP of roughly 80bn EUR, international bonds amount to merely 15.5bn EUR of notional size. For most institutional investors, this bunch of 11 papers is all there is to buy in Croatia due to poor liquidity on CROATE. It gets better – some believe the next international placement won’t come before March 2027 (next Eurobond maturity), meaning no supply for two years. Why is that? Because in the last two years government pushed for a larger share of retail bonds and hence had no incentive to actually increase the size of international bond placements.
But most importantly, where do we go from here? Can spreads narrow even further? In recent sessions, we noticed that the spread tightening actually comes from rising benchmark yields. When this happens, it’s usually a sign that the Street is short a particular Croatian bond and keeps the prices slightly elevated to find liquidity. In other words, we firmly believe that the recent spread tightening came from the current structure of the market. Can that change? Only in an unlikely event of foreigners starting to switch CROATI into – well, everything else. Our recent talks with them reveal they are sticking to their guns because of Croatian macroeconomic resilience. In other words, we don’t expect the spreads to get /much) tighter from this point on the curve, unless of course, benchmark yields make another sharp turn higher (March 05th scenario). Nevertheless, structural bid to cover outstanding short positions means the spreads don’t have more room to get higher either.