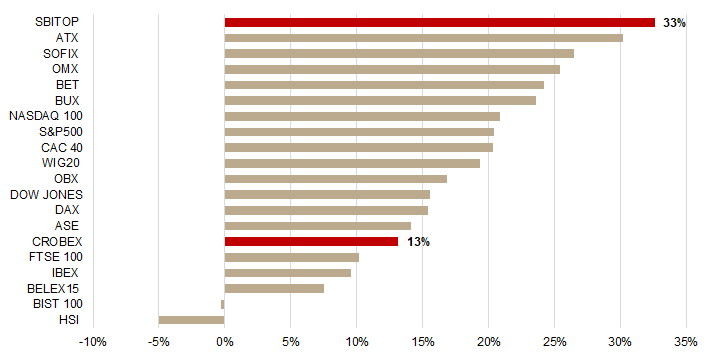
Of the 20 observed indices, SBITOP tops the list with a YTD increase of 33%.
2021 could be considered as a very solid year for equities both in the region and globally. With very solid performances of SBITOP and CROBEX, we decided to take a look at how does this performance compare to major European and global indices. For this, we looked at 20 selected equity indices.
As visible from the table, 17 out of 20 indices noted a double-digit increase while Slovenian SBITOP leads the list with a YTD increase of as much as 32.6%. It is interesting to note that SBITOP outperformed virtually all global indices (for ex. S&P500 by 12.2 p.p.). Austrian, ATX follows with also a very strong increase of 30.2%. Croatian CROBEX also noted a very solid increase of 13.1%, despite being heavily reliant on the tourism sector, which has been significantly affected globally since the outbreak of the pandemic.
On the flip side, the only index (of the observed ones) to note a YTD (first 9 months) decrease was Hang Seng, which noted a decrease of -5%.
YTD Performance of Selected Indices
Source: Bloomberg, InterCapital Research
For today we decided to present you with the updated analysis (H1 2021) of the interest coverage ratio of Croatian companies.
The interest coverage ratio is used as a measure that gives us an insight into the company’s ability to meet its interest payments. The ratio is calculated by dividing the company’s operating profit by interest expenses. Therefore, a higher ratio indicates that the company is less burdened by debt and the other way around. A ratio lower than 1 indicates that the company’s operating profit is not sufficient to cover the interest payments. We used H1 2021 figures for calculating the interest coverage ratio of Croatian companies.
Interest Coverage Ratio (H1 2021)
As illustrated on the graph, Ericsson NT operates with the highest interest coverage ratio of 95.5. It does not come as a surprise considering that Ericsson NT operates with low debt (negative net debt). Two food companies that follow are Kraš and Podravka with 32.2 and 28.3, respectively. Končar comes next with 27.1. Intuitively, all of these companies operate with relatively low debt.
On the flip side, three tourist companies were excluded from the calculation as they reported an operating loss (TTM). Of the observed, Optima Telekom has the lowest interest coverage ratio of 1.2, showing that the company’s (TTM) operating profit barely exceeds its current interest payments and indicating a relatively high debt burden compared to its operating profit. To read more about the indebtedness of Croatian companies, click here.