Oil has had a tough year as the demand outlook worsens due to the slowing of the economy across the world as the pressure of higher interest rates takes a toll on economic growth. On Tuesday the 4th of September, Brent prices briefly reached the 90$ level which was last recorded in November of 2022. The sharp spike on Tuesday in both Brent and West Texas Intermediate (WTI) crude oil prices happened after Saudi Arabia and Russia decided to prolong production cuts which were implemented earlier this year to boost prices.
The strong performance of the oil in 2021 and 2022 can be attributed to the economy growing with the labor market at levels of historical tightness. Furthermore, as the war in Ukraine started, prices spiked to 130$ per barrel as the fear of insufficient supply flooded the market with oil at levels double than the year before. Swiftly, it transferred to retail prices and pushed headline inflation into double-digit territory, and produced second-round effects as employees were demanding higher wages. Consequently, central banks across the world were raising interest rates at a pace not seen since the 1980s to levels above 2008 to subdue the wage-price spiral. Since June of 2022, oil has been in a clear downward trend as the market was pricing the effect of interest hikes on the economy thus lowering demand expectations. The average price of WTI in June of 2022 was 114$ per barrel. In June of 2023, the average price in June was around 70$ per barrel which is a 39% drop over the course of a year. Since June, prices of oil have skyrocketed as Saudi Arabia and Russia agreed to cut production to push prices higher. Since the end of June, WTI price increased by 27% even as the growth outlook for China and Europe looks increasingly worrying. Recently, European Purchasing Manager Indexes have indicated a recession in Europe, especially Germany. Additionally, the European Central Bank is staying at its path of holding rates higher for longer as the core inflation remains adamant. In China, economic problems in the construction and real estate sector related to Evergrande and Country Garden are still on the table with China trying to stimulate the economy by lowering mortgage rates, but no major stimulus package to revitalize the economy. The market is expecting a major catalyst, but as time passes it seems that the “bazooka” stimulus is not going to materialize. Bearish signs for oil prices out of China and Europe are evolving from week to week. On the other hand, the US economy is holding better than expected with GDP growth significantly higher than in Europe with PMI still in expansionary territory which is a supportive circumstance for oil prices. The main problem is the major drawdown of the Strategic Petroleum Reserve (SPR) which was created in 1975 to prevent OPEC countries from manipulating the price. The US used it in 2022 to mitigate inflation shock. The US used 40% of the SPR inventory available at the end of 2021. with total inventory falling to levels that were last recorded in 1983. The remaining SPR inventory can be used to prevent Saudi Arabia from manipulating prices which is exactly what it is intended for, but the only reasonable way of solving the problem with high oil prices is diplomatic action. Over the past year, Venezuelan and Iranian oil has been brought back to the market combined with the US raising its production. However, the US did not manage to pass its production peak from 2019, but it is surely on the way to surpass it.
To conclude, the oil market’s tumultuous journey over the past year has been marked by price swings influenced by a multitude of global factors. From highs driven by supply fears and tight labor markets to a sharp decline amid interest rate hikes, it now faces fresh volatility due to geopolitical and economic uncertainties in Europe and China. The US, with robust economic growth and higher GDP, remains a stabilizing force. However, the major drawdown of the Strategic Petroleum Reserve highlights the need for diplomatic solutions in managing oil prices, as the world watches closely for developments due to the ongoing fight for inflation.
US Strategic Petroleum Reserve levels
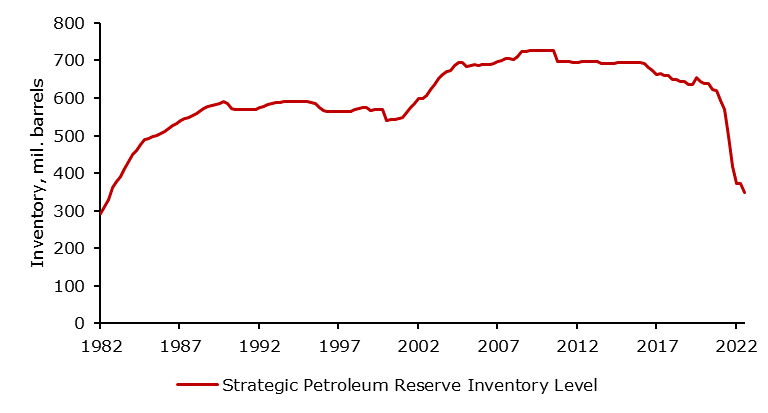
Source: Bloomberg, InterCapital
In August 2023, the total equity turnover on the Ljubljana Stock Exchange increased by 36.4% MoM (68.8% YoY), while SBITOP declined by 7.7% MoM, ending at 1,159.46 points. On a YTD level, LJSE experienced solid recovery with SBITOP increasing by as much as 10.7%.
The total equity turnover on the Ljubljana Stock Exchange amounted to EUR 36.4m, representing an increase of 68.8% YoY, and 36.3% MoM. This would also mean that the average daily turnover in August amounted to EUR 1.58m. In terms of the indices, Slovenia’s main index, SBITOP, decreased 7.7% MoM during August and ended the month at 1,159.46 points. At the same time, SBITOP TR declined by 5.9% MoM, ending the month at 1,548.41 points.
Monthly equity turnover on LJSE (January 2022 – August 2023, EURm)
Source: LJSE, InterCapital Research
Looking at equity turnover, the largest turnover was recorded by Krka, with a turnover of EUR 14.5m (or 39.9% of the total equity turnover for the month), followed by Triglav, at EUR 6m (or 16.6% of the total), NLB at EUR 5.8m, and Petrol at EUR 3.5m. In fact, this would mean that the top 5 most traded stocks accounted for 89.3% of the total turnover, while the top 10 would account for as much as 99.7%.
Taking a look at the SBITOP constituents’ performance in August, we can see that all except one recorded decreases, with only Equinox recording a slight 0.8% growth. The largest decrease was recorded by Triglav and Petrol, at 14% and 10.6%, respectively, followed by Krka at 8.3%, Luka Koper at 7.6%, Cinkarna at 6.5%, and Sava Re at 5.9%. August in Slovenia was marked by the floods which caused significant damage and thus caused higher claims to insurance companies, which meant that a strong decline in profitability by the end of the year would be recorded. Cinkarna was also directly affected by this, albeit to a lesser extent compared to the insurance companies. If you would like to read more about this, click here. August is also the month when the majority of the Slovenian companies publish their H1 results. Even though some of them recorded positive developments in terms of sales (Krka, NLB, Sava Re, and Triglav), and op. profitability (Krka, Petrol), the overall negative sentiment was still strong enough to drive the prices down despite this, resulting in the overall decline in share prices across most of the Slovenian blue chips.
Performance of SBITOP constituents (August 2023, MoM, %)
Source: Bloomberg, InterCapital Research
Moving on to the YTD performance, we can notice a more positive picture, with 6 out 9 SBITOP constituents recording growth, 2 remaining flat (Cinkarna and Equinox), and only Triglav recording a decline of 14.2%. The largest increases were recorded by Luka Koper at 26.2%, followed by NLB at 24.7%, Krka at 13.6%, Petrol at 10%, and Sava Re at 6.3%. It should be noted that the overall sentiment on the market in 2022 was quite negative, due to the high inflation rates and thus the interest rate hikes by ECB. This directly influenced the companies as prices of labor and services increased and borrowing costs were higher. Lower valuations are a result of interest rate hikes, as well as higher investment risk for investors due to these changes. As such, the growth recorded in 2023 YTD is more of a return to previous levels as most of these companies recorded a decline in their share price in 2022.
Performance of SBITOP constituents (2023 YTD, %)
Source: Bloomberg, InterCapital Research