Global economic slowdown and convergence to Hungary have been the narratives explaining the recent trends on CROATI curves. How plausible these narratives are and are there any undervalued bonds, find out in this brief analysis.
The beginning of the year was so far characterized by yield suppression and spread contraction across the board as central banks became sensitive to the indicators showing weakness in the global economy. The recent macroeconomic backdrop has been supportive for bull flattening of the Croatian USD yield curve, as the chart below clearly demonstrates – notice just how the curve became flat in the last two months. Currently, there’s barely any term premium on the longer end (CROATI 2023 USD @ 3.61% YTM and CROATI 2024 USD @ 3.62% YTM versus CROATI 2021 USD @ 3.54% YTM) and from the chart it’s quite clear that the greatest yield suppression was reported on CROATI 2024 USD.
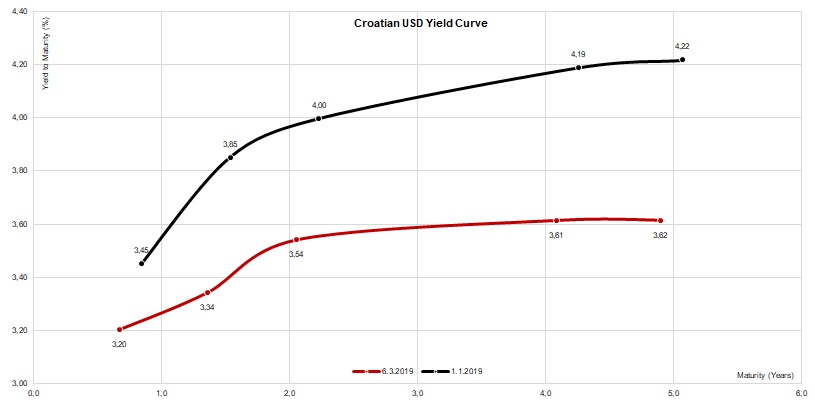
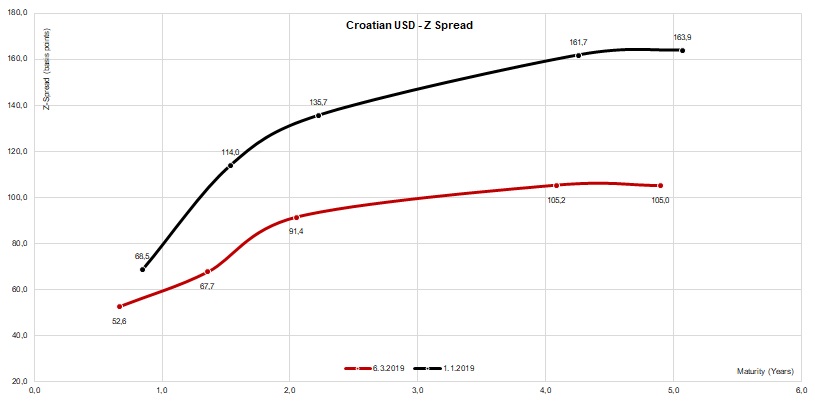
According to the Z-spread curve, the bull flattening did leave some term premium left between CROATI 2021 USD and CROATI 2023 USD, but what’s interesting in particular is that CROATI 2021 USD appears to be slightly mispriced in both yield and Z-spread terms. A simple linear interpolation using 104.30 as clean price for CROATIA 2020 USD and 107.10 for CROATI 2023 USD (3.33% and 3.61% in yield terms, respectively) gives us 3.40% as the YTM where this paper should be trading. Our screen shows that the instrument might be bought @ 3.50% (105.62 clean), giving it at least 10 bps above the interpolated yield. As stated, the bond is slightly undervalued, with a focus on the word “slightly”.
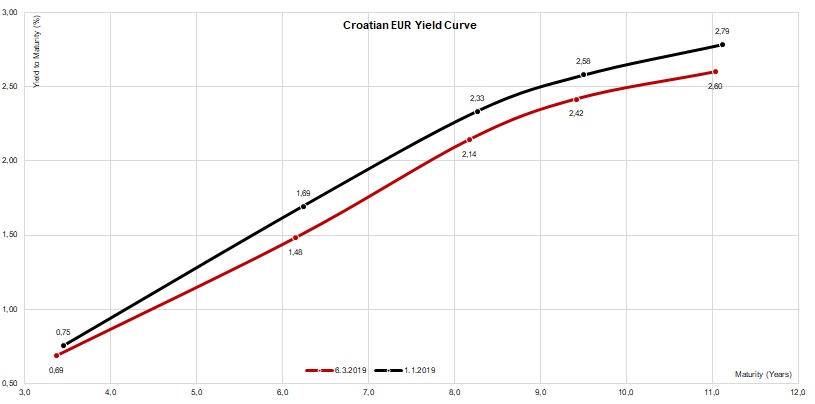
Looking at the EUR curve in the last two months, there’s an apparent move south, but without any significant loss of shape; the yields contracted almost uniformly by 19-22bps, the largest suppression going on CROATI 2025 EUR. The lack of paper is evident and anecdotal and there’s a feeling that dealers in the Street might have emptied their books, so at least some of them have their offers quoted uncovered – meaning that if a buyer lifts these offers, the dealer ends up naked short. Of course, most of the dealers aren’t willing to end up short in the first place, especially on the paper such as CROATI 2028 EUR, since buying it on the secondary market might be the scenario for the next movie from the “Mission Impossible” franchise; instead, the dealers prefer passing the quote, stating clearly that they’re out of inventory.
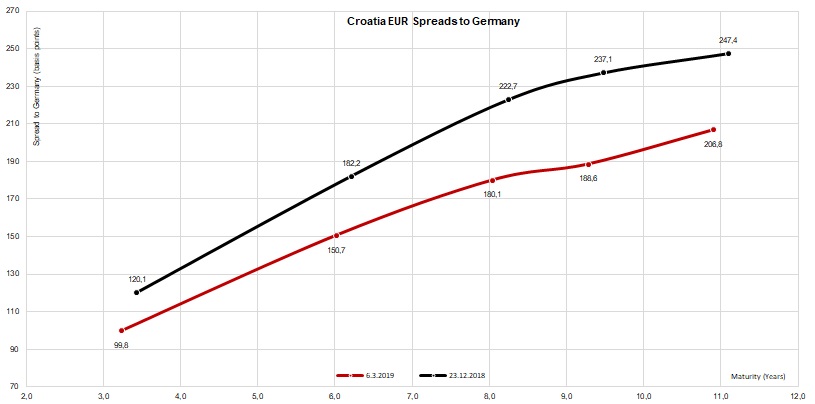
Speaking further about CROATI 2028 EUR, it’s worth mentioning that the paper was issued last June @ 121.5bps above REPHUN 1.75 10/10/28. Interestingly enough, the return on Croatian paper is poised half way between REPHUN (1.17%) and ROMANI (2.71%). By today, this spread had contracted to about 75bps, the lowest value since the paper was offered to the public. At the same time, CROATI 2025 EUR is traded some 48.7bps above the interpolated REPHUN curve (1.257% YTM for CROATI versus theoretical 0.77% for REPHUN), while CROATI 2022 EUR trades merely 23.5bps above theoretical REPHUN (0.565% versus theoretical 0.33%). In other words, the spread to REPHUN decreases as maturity of the paper gets nearer, making convergence to Hungary the plausible narrative of the current spread contraction.
As we had the pleasure to host Dalekovod for our traditional Investors’ Day @InterCapital, we are bringing you the highlights from the meeting.
As we had the pleasure to host Dalekovod, a Croatian construction company, for our traditional Investors’ Day @InterCapital, we are bringing you the highlights from the meeting attended by Mr. Tomislav Rosandić (CEO), Mr. Ivan Kurobasa (COO), Mr. Tomislav Đurić (CFO) and Mr. Đuro Tatalović (CRO). The company’s representatives gave an overview of Dalekovod’s financial performance in 2018.
According to it, the company recorded sales of HRK 1.2bn, which represents a decrease of 20.5% YoY. The management attributes this decrease to the postponement of tenders expected in 2018 to 2019.
Dalekovod Operating Revenues ( 2015 – 2018) (HRK m)
When observing the gross margin, it amounted to HRK 60.6m, which represents a decrease of 67.3%. Such a high decrease could partially be explained with above-mentioned postponement of tenders. Besides that, Dalekovod observed a couple of one-offs including a claim regarding 2 projects in Norway of HRK 25m, which was not recorded in their 2018 P&L, however a higher expense was recorded. Furthermore, the company observed a strike in 2018, which cost the company HRK 30m, according to the management.
Going further down the P&L, the company recorded a negative EBITDA of HRK -32.5, which is by HRK 113m lower compared to 2017. When adjusting EBITDA for value adjustments, it amounted to HRK -18.9m.
When observing EBT, Dalekovod recorded HRK -70.8m which could be attributed to a FX loss of HRK 20.3m which was offset by extraordinary revenue of HRK 32.7m.
In 2018, Dalekovod recorded a net loss of HRK 76.4m which is a decrease by HRK 88m compared to 2017.
EBITDA & Net Income (2015 – 2018) (HRK m)
It is also noteworthy that in 2018 Dalekovod sold Dalekovod Professio for HRK 115m. Of that 55% of the amount will be used to service their Mezzanine debt, which is in line with
Turning our attention to the outlook for 2019, the management stated that 2019 started well regarding new deals being contracted, as a result of the above-mentioned postponement of tenders from 2018. As of 28 February 2019, Dalekovod’s non-consolidated deals are worth HRK 955m, which represent an increase of 34% compared to 2018. Besides that, the company also has HRK 537m of deals concluded already for 2020. Also, note that the management stated that they plan on improving their results through operating restructuring which will focus on optimizing G&A costs.
The management also mentioned that according to ENTSOE, investments in transmission lines will observe a significant increase in the EU until 2030, which is expected to amount to EUR 130bn. Of that EUR 32 – 52bn can be attributed to Germany, EUR 7.9bn to Norway, EUR 3.6bn to Sweden and EUR 0.2bn to Croatia. These are all key markets for Dalekovod where it is working directly and has plans to further position itself as key niche player.
Revenue Breakdown Market Segment*
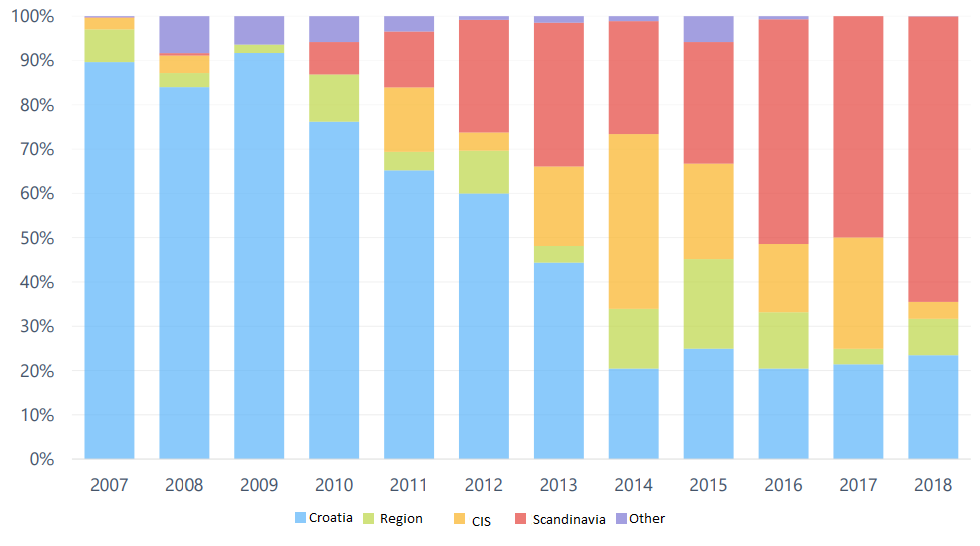
*non-consolidated revenue
The tanker will be chartered out to a prominent charterer at approximately USD 16,000 per day.
Tankerska Next Generation published a document in which they state that they secured 12-month time charter employment for one of the ECO class product tankers.
The tanker will be chartered out to a prominent charterer at approximately USD 16,000 per day under usual market terms with an additional charterers’ option to extend the contract with an escalation, under similar terms. The deal starts from mid-March 2019.
Note that in 2018, Time Charter Equipment amounted to USD 13,201 per day which represents a decrease of 15% YoY.
As a reminder, Tankerska Next Generation reported a sharp drop in financials in 2018, owing mostly to the fact that the spot rates were not high enough to replace the expired time charters. Out of 6 ships, 3 entered 2018 with previously arranged time charters. Vukovar expired in April (TCE of USD 17,250 a day), Zoilo in July (17,750) and Dalmacija in September (17,750). Excluding these previous arrangements, according to our calculation it seems that TNG had a TCE of about USD 9,500 a day in 2018.
Note that according to our calculations TNG would record an EBITDA breakeven at average TCE of roughly USD 7,200 per day, while they would record a net income breakeven at average TCE of roughly USD 12,600 per day.
To read more about TNG in our blog click here.
Charter Rates According to Morgan Stanley’s Maritime Report
At the current share price the dividend yield is 7%. The ex-dividend date is 6 June 2019.
Electrica S.A. published a document in which they proposed a dividend of RON 0.73 per share. At the current share price the dividend yield is 7%.
Note that the ex-divided date is 6 June 2019.
In the charts below, we are bringing you Elcetrica’s historic dividend payout and their dividend yield.
To read about Electrica’s 2018 preliminary results click here.
Dividend Per Share (2015 – 2019) (RON)
Dividend Yield (2015 -2019) (%)*
*compared to the share price a day before the dividend proposal
