West Intermediate prices have been falling rapidly since the end of September. Prices reached a high of 95$ per barrel on the 28th of September and fell to 72$ as the demand concerns are growing both in Europe and across the Atlantic. However, the boost for prices coming from the supply side is restricted as recent OPEC+ cuts haven’t made any impact on rising prices.
The oil market has been very strong in the third quarter of the year as the concerns over supply deficit drove markets higher and the US economy seemed solid and well protected against recession. At the start of the fourth quarter, oil prices have been falling even as the escalation in Israel has been brought to attention and Iran threatened to be involved in the war. Also, at that time Energy Information Administration released a report showing that the oil demand was exaggerated, thus leading to further downward pressure on oil prices. The labor market is less tight than previously thought according to recent Nonfarm Payrolls and JOLTS data.
On the 30th of November, OPEC+ announced additional cuts totaling 2.2 million barrels per day for the first quarter of 2024. Most of the market had already expected the rollover of the Saudi and Russian cuts. Therefore market reaction after the meeting was to the downside as they did not deliver surprises. In the future, further cuts are probably not on the table as most current cuts are voluntary and it seems that the cohesion of the OPEC countries is not at the highest level right now. They are currently open to extending cuts into 2024, however, the price paid for the cuts is high as the economy of Saudi Arabia is highly dependent on oil production. Furthermore, the loss of the OPEC market share reduces their overall global political power as the US is raising production. They did not manage to raise prices and do not have many more options on the table to further reduce supply. The upside to the oil prices is losing ground, therefore leaving more territory to more downside pressure as the economy is slowing down due to the restrictive monetary policy and rising oil inventory levels.
The upside to the price might be due to the potential escalation of the Guyana-Venezuela conflict which might prop up oil prices back as there is high exposure of Exxon and Hess in the offshore oil production and worsening of the diplomatic relations between the US and Venezuela which raised hopes of Venezuela coming back to the oil market. Huge repricing on the bond market due to falling inflation and worsening economic outlook did not impact oil markets, however, correlation has probably worked the other way around (lower oil prices lead to lower inflation, thus leading to lower bond yields).
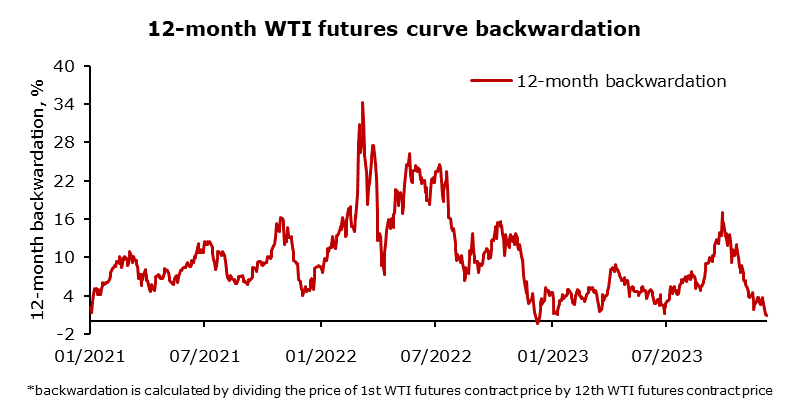
Futures spread on the oil market remain weak. Backwardation has weakened heavily over the past two months as the front end of the curve even transformed into contango until May 2024. Backwardation is calculated by dividing the WTI price in the first and the twelfth-month futures contract and currently amounts to 1%. On the 28th of September, 1-year backwardation was around 17% and sharply reduced to 1% in a matter of two months. This is a significant bearish signal for future oil prices as supply disruption and deficit concerns weaken. However, crack spreads are behaving differently and rising over the past two months after plummeting in September. Crack spreads may stabilize, however, the divergence between oil prices and crack spreads may indicate at least a small recovery in oil prices.
The oil market is navigating a complex landscape, witnessing a rapid decline in prices due to escalating concerns over demand and limited impact from recent OPEC+ cuts. Supply-side pressures haven’t compensated for the downturn, with geopolitical tensions failing to significantly buoy prices. Prospects suggest diminishing upside potential as economic slowdowns, restrictive monetary policies, and rising inventories converge to exert further downward pressure. However, potential geopolitical escalations, notably in the Guyana-Venezuela conflict, could offer a reprieve. Yet, the weakening futures spread, particularly the sharp decline in backwardation, signifies a bearish sentiment for oil prices, despite crack spreads showing signs of a slight recovery.
Source: Bloomberg, InterCapital
Today, we’re bringing you the overview of the P/E as well as the cash-adjusted P/E for Croatian blue chips, based on the recent 9M reported data.
First of all, a few disclaimers. The data for the balance sheet items (cash and cash equivalents) is based on the information released during the 9M 2023 reports, while the P&L items (net profit) are based on the trailing twelve months (TTM) data, starting in 9M 2023 and going backward. This is done to provide a like-for-like comparison. Also, HPB has been excluded as it operates in the financial/banking industry, and as such it isn’t comparable to other companies. Furthermore, even though Adris (pref.) is part of the CROBEX10 index, both Adris (regular) and Adris (pref.) were used here, as the cash and cash equivalents the Company applies to both shares. As such, the P/E and cash-adjusted P/E can be seen as one representing Adris as a whole, and not one or the other share types. Finally, the net profit to majority was used, while the number of shares outstanding, was adjusted for the number of treasury shares held by respective companies.
P/E of Croatian blue chip companies (TTM 9M 2023 results)
Source: Companies’ data, ZSE, InterCapital Research
Starting off with the P/E, AD Plastik recorded the largest one, at 43.2x. The group is trading for a long time at a high multiple due to a low bottom line. The group’s operations were materially affected by a semiconductor shortage, that affected the whole automobile industry. Further, the geopolitical situation further amplified bad macro conditions for the company as the Group has two production capacities in Russia. Consequently, AD Plastik’s operations suffered.
Atlantic Grupa follows AD Plastik with a high P/E of 26.5x. The Company did record an improvement in its share price (+15% YTD), but its net profit was still quite low (EUR 26.6m on a TTM basis), which led to this high P/E. Span is currently traded at a higher P/E compared to its recent share price development, as Span recorded the largest decrease of 11.6% on ZSE from Croatia blue chips on ZSE. We note this is the second month of Span’s share price decreasing with a 14.4% decline during September. The share price decreased on the back of lower-than-expected results 9M results, especially Q2 & Q3 bottom line. Results were lower this year with seeds from its strong investment cycle in high-added-value segments materializing in the form of top-line & staff cost growth, resulting in lower profitability margins. Span is followed by HT with a multiple of 18.3x.
Following HT, there is Valamar Riviera, at 17.6x. Valamar did not record that much of a gain this year (+6.2% YTD), while its TTM net profit amounted to EUR 29.6m, also in a quite similar situation as Atlantic Grupa. What both of these companies have in common is the cost increases that we have witnessed starting all the way back in the middle of 2021, which led to a profitability decrease. Valamar was also further affected by the pandemic, and subsequent price increases in 2022 and now in 2023. As such, both of the companies’ bottom lines are under pressure, leading to an increased P/E. Even with the most recent stabilization of cost pressure in the last quarter. Next up, there is Adris at a P/E of 15.7x, Podravka at 13.9x, Končar at 13.2x.
On the flip side, the only company to record a negative P/E was Atlantska Plovidba at -4.9x (N/A in other words). Its share price has been somewhat subdued, especially compared to previous years, at 1% decline. The Company is tied to the movements in the shipping industry. While this allowed it to achieve some of the best results in its history in 2021 and partly in 2022, now that the shipping industry is under pressure due to the macroeconomic and geopolitical situation, so are the profits of the companies operating in it, including Atlantska Plovidba. As such, the results it recorded are what could be expected in the industry right now.
Cash-adjusted P/E of Croatian blue chips companies (TTM 9M 2023 results)
Source: Companies’ data, ZSE, InterCapital Research
Moving on, we presented you the cash-adjusted P/E, as Croatia blue chips generally have a lot of cash & cash equivalents. The largest change can be seen by Valamar Riviera with a 5x decline to 12.6x, Končar with a 3.5x decline and Atlantic Grupa with a 3.2x decline.
Cash & cash equivalents (9M 2023) to current market capitalization of Croatian blue chip companies (%)
Source: Companies’ data, ZSE, InterCapital Research
Of course, the amount of cash and cash equivalents available for the companies in question played a huge role here. For example, Valamar Riviera’s cash accounted for 28.2% of the market cap, Končar’s cash accounted for 26.3% of the combined market cap, and Ericsson’s cash accounted for 23% of the market cap. On the flip side, Podravka’s cash and cash equivalents were the lowest as compared to their market cap, at 3.7%.