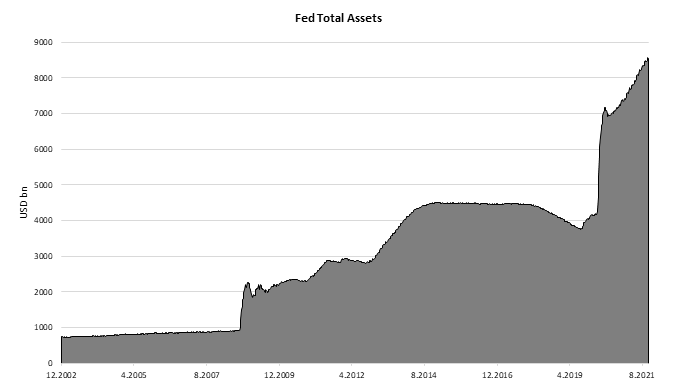
Last night Fed decided to reduce its QE pace by USD 15bn in November and further 15bn in December. Slightly dovish Fed still ensures markets that inflation should be largely transitory while it will be patient with rate hikes.
Yesterday’s decision to begin decreasing its QE pace was signaled in July 2021 while confirmed in September’s meeting so Fed’s confirmation was widely expected. Namely, most of the analysts rightly expected Fed to announce decrease by USD 15bn from November meaning that they will buy USD 70bn of USTs and USD 35bn of agency mortgage-backed securities in November. Furthermore, Fed stated that they will decrease purchases by 15bn in December as well while saying that “similar reductions in the pace of net asset purchases will likely be appropriate each month”, meaning that corona related QE should end in June 2022. However, this still leaves room for Fed to change its tapering schedule in case economic outlook changes in each way. Regarding inflation expectations, statement was little changed as Fed said that “inflation is elevated, largely reflecting factors that are expected to be transitory”. This part of the statement was seen as slightly dovish by the market as Fed still insists on its transitory story. To confirm victory of dovish camp, Mr Jerome Powell in his Q&A session said that Fed can be patient with increasing rates, resulting in steepening of the yield curve. Nevertheless, looking at the Eurodollar futures market still expects one full hike in June which means that Fed would end its QE program and immediately start increasing short term rates. This scenario looks a bit stretched considering their latest statement so inflation should increase further and stay elevated for longer for market expectations to be fulfilled.
Looking at the markets one could say that there are some market participants that did not expect yesterday’s scenario although move was signaled few months ago. Both 5Y and 10y went up by 5bps while 30Y was up by almost 10bps. On the other side, 2Y yield fell by 5bps to 0.45%. So, it is not so easy to explain yesterday’s move on rates considering expectations. One explanation could be that long term rates went up because Fed was dovish once again meaning that they are falling even more behind the curve with market pricing policy error. But in that case short term rates would also have to rise faster but the opposite happened as Mr Powell stated they can be patient on hiking. Most likely there are a lot of information to process and a lot of possible scenarios while inflation is still a wild card with market being largely polarized. Recent intraday moves on rates confirm this. So, what to expect further?
As many analysts were talking about taper tantrum this year and comparing current situation with the one 8 years ago, it is worth our while to look what happened back then. Namely, in May 2013 investors started to worry weather Fed will start to taper its USD 85bn a month purchase program after the Wall Street Journal article suggested that Fed plans to close its QE. The confirmation came few weeks later when Fed’s minutes showed that some of the FOMC members pushed for the end of QE. The term taper tantrum was coined in the media after yields increased rapidly, with UST 10Y rising from 1.60% in the beginning of May to 3.0% in August. However, real tapering started only in December 2013 (meaning that yields peaked before taper started), when Fed decided to reduce the pace of its asset purchases to USD 75bn rather than 85bn a month and the program was fully ended in October 2014. Back then (May 2013), US was slowly recovering from the GFC, GDP grew by around 2.0%, unemployment rate stood at 7.5% while PCE measured inflation stood at 1.0%. Looking at these numbers, it is logical to ask whether Fed is largely behind the curve today, or we are so used on low interest rate environment that history is only that, history.
Source: Bloomberg, InterCapital
Today, we present you with the DuPont analysis of several Croatian companies, a technique used to break down the ROE into its main drivers.
The DuPont analysis is a useful technique that is used to differentiate between multiple drivers of ROE.
This model gives the stock analysts and investors a way to examine the profitability of a company using information from both the balance sheet as well as the income statement.
This gives the analyst a clear idea of a company’s financial health and operating efficiency. The following analysis is based on 9M 2021 results.
ROE of Croatian Companies (TTM results)
In general, the DuPont analysis allows analysts to have an in-depth overview of a company, giving them the ability to better see the company’s strengths as well as its weaknesses.
This allows analysts to quickly know which part of the business to look at (margins, inventory management, debt structure) for a closer look.
However, it should be mentioned that the measure is still broad and shouldn’t be used as a replacement for a detailed analysis.
The DuPont analysis shows us that ROE is affected by three things:
- Operating efficiency, which is measured by the profit margin
- Asset use efficiency, which is measured by the total asset turnover
- Financial leverage, which is measured by the equity multiplier
Out of the observed companies, Ericsson NT has the highest ROE, with 40.6%. The main reason for this is the high asset turnover of 1.84, which indicates an effective usage of the Company’s assets.
Similarly, to Ericsson NT, Optima Telekom also has a high ROE of around 33.3%. However, this is where the DuPont analysis becomes useful. With it we can see that even though the Company’s ROE is high, the main culprit behind it is a high equity multiplier of 38.4, which could be attributed to a relatively low equity. As a reminder, the Company has been observing losses in previous years, which has significantly decreased the company’s equity.
Among food companies, Atlantic Grupa has the highest ROE of 13.5%, followed by Podravka with a ROE of 8.4%. Both companies have a similar ROE breakdown structure, with Atlantic Grupa outperforming Podravka slightly on all points. Compared to this, we have Kraš, which even though operates in the same industry and should have similar margins, only has a ROE of 4.3%. The main reason for this discrepancy compared to the aforementioned companies is the lower profit margin of only 3% for Kraš.
Profit margin breakdown (TTM)
Today we bring you the updated analysis (9M 2021) of the interest coverage ratio of Croatian companies.
The interest coverage ratio is used as a measure that gives us an insight into the company’s ability to meet its interest payments. The ratio is calculated by dividing the company’s operating profit by interest expenses. Therefore, a higher ratio indicates that the company is less burdened by debt and the other way around. A ratio lower than 1 indicates that the company’s operating profit is not sufficient to cover the interest payments. We used 9M 2021 figures for calculating the interest coverage ratio of Croatian companies.
As can be seen on this graph, the best performing company is Ericsson NT which operates with the highest interest coverage ratio of 93.8x. Considering Ericsson NT’s low debt, this does not come as a surprise. Following Ericsson NT are Končar, Podravka, Kraš, and Atlantic Grupa, with 43.8x, 33.8x, 32.8x, and 26.8x respectively. All of the aforementioned companies operate with low debt levels.
All the remaining observed companies have an interest ratio of under 10, with the most interesting case being Optima Telekom. When compared to Q1 2021, they have increased their interest coverage ratio from 0.2 to 1.2.