If you think that Serbian USD debt placement last Monday was nothing extraordinary, then you haven’t been paying close attention. Don’t worry, that’s why you have us – to draw your attention to the important stuff. Serbia basically bought back 900mm USD of the old debt, placed 1.2bn USD of the new one and hedged the remaining USD liability for the first time ever. According to the central bank data the new notes were placed at 2.35% YTM before cross currency basis swap and 1.066% after the swap. This was an excellent job for the Ministry of Finance. But what about the investors? Well, find out in this brief research piece.
Serbia returned to the US dollar market after a seven-year long pause with a 1.2bn USD December 2030 note (SERBIA 2.125 12/01/2030 on BBG). The bond placement was preceded by a tender offer to buy back the 900mm USD of the outstanding note maturing in September 2021 at 105.70 (about 0.32% YTM). The tender was successful and the outstanding size of the short note was hence reduced from 1.6bn USD to 700mm USD. One part of the motivation to place the first greenback paper since 2013 came from the fact that Serbia was close to losing it’s EMBI+ status, which was quite important to the sovereign in the previous years (a detailed description of the four criteria could be found here; third condition of eligibility requires that the instrument included must have at least one year of remaining maturity, which 2021 notes lost this September).
When the orderbook opened up on Monday, the leads were flashing IPTs @ MS+190bps, which tightened to MS+170bps around 14.00 CET before finally settling @ MS+150bps at the closing of the book (2.35% YTM and 98.00 clean price). On Friday we have spotted the new note trading at 98.40 on “grey market” (MS+147bps, indicating 3bps of tightening), however in the days following the primary market we have heard of trades being executed as high as 98.75 (that was a hair’s breadth below MS+140bps because at a time EUSA10 was higher as well). Spread tightening was a mirror image of weak allocations received by the participants: a 1.2bn USD placement was met with 4.8bn USD orderbook (4.0x bid-to-cover) but insight from the leads revealed that short term note holders participating in the tender were given a priority in allocations. Unless you had the short paper and wanted to convert, you were quite likely to be allocated 5.0%-10% of the total order submitted.
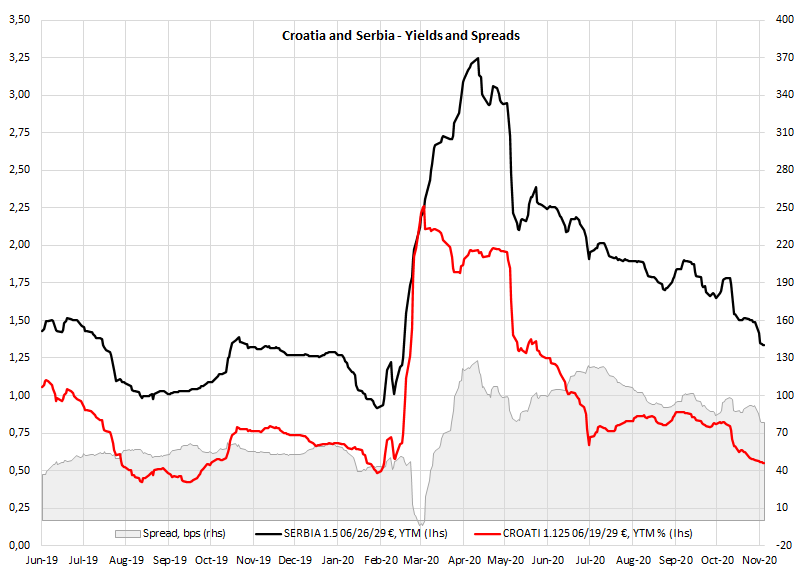
Nevertheless, in our view the current valuations offer support for the Serbian outstanding notes maturing in 2027 and 2029. Namely, if you have a EUR-denominated balance sheet, a quick and dirty hedging of the Serbian 10Y USD paper will cost you about 0.43% per annum through selling a plain vanilla EURUSD 10Y FX swap (we have used EURI10Y Index on BBG for calculation, priced this morning at -.4785/-.4393; since you would be lending euros/borrowing dollars on a 10Y term, you would have to lift the offer at -0.4393%). This FX hedging trade would push your premium from reoffer MS+150bps (if you were lucky enough to get any allocations at all) to about MS+107bps. A quick look on the screen shows that SERBIA 3.125 05/15/2027 is traded at clean 112.25 (1.14% YTM; MS+155bp) while SERBIA 1.5 06/26/29 is traded at clean 101.65 (1.29% YTM; MS+161.5bps). You see our point – both notes are traded at a wider FX-adjusted spreads, although the main issue here is liquidity (can you really switch a larger size of SERBIA 2.125 12/01/2030 into any of the two shorter notes?). For this purpose we see a lid being put on the further narrowing down of the risk premium carried by the brand new Serbian greenback bond, but the outstanding two notes might be supported by switching away from SERBIA 2.125 12/01/2030 and into SERBIA 3.125 05/15/2027 or SERBIA 1.5 06/26/29; i. e. the spread in these two now might have room to tighten. A similiar conclusion could be derived from taking a glance at the spread between Croatian and Serbian 9-year € notes (also bear in mind that Moody’s is scheduled to review Serbian credit rating on December 11th, about a monght after upgrading Croatian sovereign rating by one notch on November 13th):
Some investors still think that SERBIA 2.125 12/01/2030 is a buy opportunity and the only argument they have at their disposal is the fact that it can still be purchased around 2.30% YTM levels, which can be as high as 2.00% on an FX-adjusted basis (some investors can borrow USD at 0.30% 1w repo rate). At first this is much better than 1.14% offered on SERBIA 3.125 05/15/2027 or 1.29% offered on SERBIA 1.5 06/26/29, right?
Wrong. We advise caution with this methodology since short term borrowing and investing in the long-dated bonds exposes you to the roll risks, reducing your P&L should the short term interest rates go up. This is especially problematic in the case of US dollar because American economy is likely to be the first one to start recovering from Covid-induced recession (reasons are numerous: it’s the most competitive economy in the world, demography looks OK and long term growth potential is still untapped), which vouches for higher short term interest rates later down the road. For this purpose we have been comparing the three Serbian bonds on I-spread basis, accounting for FX hedging as well.
But forget Serbian international paper, here’s something worth knowing about Serbian local paper. In February this year (before the pandemic) Serbian finance minister Siniša Mali announced a memorandum of understanding signed with Euroclear in order to allow settlement of the Serbian local paper through ECLR/CEDEL. Actually, a similar memorandum was signed with Turkey as well, meaning that Euroclear might be delivering a push to include more EM local debt in their pool of tradable assets. At the same time the Ministry of Finance is pushing to raise the share of foreign investors in the local short term paper. With inflation and EURRSD in check, SERBGBs might be the trade of the year in 2021 when most of the investment houses forecast considerable inflows into EM assets.
On the same day that Serbia was placing an international bond, Serbian Minister of Finance Siniša Mali was presenting a draft 2021 budget in the parliament. The Ministry of Finance expects a +6.0% GDP growth in 2021, one of the reasons being large infrastructure projects planned for next year. Serbian government plans to borrow up to 2.7bn EUR in 2021 alone from Chinese banks in order to finance projects such as Bubanj Potok – Pancevo bypass road (680mm EUR) and Belgrade-Zrenjanin-Novi Sad motorway (510mm EUR), to name just a couple of big-ticket projects. Serbia also plans a 1.5bn EUR deficit next year (revenues @ 11.4bn EUR, expenses @ 12.9bn EUR) and foreign borrowing in size of 3bn EUR (the remaining 700mm USD of the 2021 notes have to be refinanced).
Croatian Bureau of Statistics published its first estimate for Q3 2020 GDP on Friday. In real terms GDP decreased by 10.0% YoY (seasonally adjusted data), beating analyst estimates by a few percentage points.
Croatian GDP fell by 10% in Q3 beating analyst estimates by a few percentage points. Such a better than expected performance could be attributed to a significantly better tourism result in Q3, which is one of the main drivers of Croatia’s GDP. As a reminder, in Q3, Croatia observed a decrease of 51.7% in tourist arrivals and a 41.6% decrease in nights realized, while during first lock-down period even higher decrease of arrivals for Q3 (-70%) was expected. Results proved to be much better due to strong pick-up in arrivals in July, that lasted until early-mid August when foreign governments began to introduce travel bans due to spikes in newly infected rates. It is also important to mention that the recent harsher restrictions imposed the Government will definitely leave its toll on Croatia’s GDP in Q4. We expect to see macro analysts revising their Q4 estimates, which were in mid single digits, to double digit figures.
The main contributor to GDP – final consumption – in Q3 dropped by 5.0% as local spending was subdued even though economy was reopened from June, but uncertainty remained high. Summer season started later than usual, as one of the main Croatia’s tourist inbound countries (Germany) abolished restriction of travelling in the late June. Personal spending of foreign tourists was a result of drop in arrivals (Q3 51.7%). Therefore, the largest part of final consumption, household expenditure decreased 7.5% YoY, while general government’s expenditure amounting to more than 1/4 of final consumption accelerated and grew by 1.5% YoY. Pandemic continued to pose strong impact on Croatia’s reduced household consumption that has in 9M of 2020 decreased for 6.73% (at current prices), which could not be offset by higher general government spending that in the same period grew by 5.10% (at current prices). Due to reopening of economy investments resumed, albeit at a slower pace than last year, so drop in gross fixed capital formation decelerated, falling by 3% YoY (vs -14.7% in Q2). Due to strong slow-down in flow of people and goods across borders, decrease in imports and exports of goods and services was evidenced at 14.1% and 32.3% respectively. Due to halved summer tourist season, the decrease in exports of goods and services (-32.3%) was in majority driven by drop in exports of services of -45.3%. To display what a strong impact tourism has on Croatian GDP, we can see from exports of services that have in 9M 2020 almost halved at current prices amounting to HRK 51.9bn. Exports of services have accounted for 44% of total exports (vs. 58% in 9M 2019). On the other hand, exports of goods in 9M have decreased only 8% YoY. So total exports have in 9M of 2020 decreased 30% YoY, while imports have decreased 16% YoY.
Croatian GDP, Real Growth Rates (%, YoY)*
*Quarterly Gross Domestic Product, seasonally adjusted real growth rates
Comparing Croatia to other EU countries, the drop in GDP in Q3 was the highest among all EU countries, due to Croatia’s strong dependency on tourism. Other Mediterranean countries like Spain (-8.7%), Portugal (-5.7%), Italy (-4.7%) and France (-4.3%) fared much better in Q3 despite outperformance of Croatia’s summer season mostly due to the specificity of the tourist structure that is mostly reliant on foreign guests. Q3 GDP drop was also lower in Austria (-5.3%), Belgium (-5.2%), Hungary (-4.7%), Germany (-4.2%) and Slovakia (-2.2%). Slovenia will publish its first estimate of Q3 2020 GDP today.
Luka Koper published their 9M results last week, showing an 11% YoY decrease in sales, a 30% YoY decrease in EBITDA and a net profit of EUR 22m (-37%).
In 9M 2020 Luka Koper posted sales in the amount of EUR 154.9m, representing an 11% YoY decrease in sales. The drop in sales came as a consequence of the pandemic and related measures which resulted in a lower volume of throughput and increased volume of goods in warehouses.
EBITDA fell 30% YoY, amounting to EUR 42.6m. The decrease is due to lower sales as OPEX remained flat on YoY level.
Below the operating line, the net financial result improved by 36% YoY amounting to EUR 1.6m. Finally, net profit amounted to EUR 21.8m, representing a 36.9% YoY decrease.
Luka Koper Key Financials (EUR 000)
Turning our attention to the balance sheet, Luka Koper remains operating with virtually no debt. At the end of the 9M period their net debt amounted to EUR 15.8m, which translates to 0.3x net debt/EBITDA.
Despite the challenging environment in which the company operated during the 9M period, Luka Koper’s CAPEX amounted EUR 50m, double the amount seen in the same period of last year. Investments were mainly allocated to the construction of the parking garage, construction of a new RO-RO berth, construction of railway tracks and the purchase of a new transhipment machinery and commencement of the construction of the Pier I extension.
Luka Koper Maritime Throughput (in tons)
In the 9M period of 2020, Luka Koper recorded a throughput of 14.9m tons. All cargo groups experienced a negative effect of the COVID-19 pandemic which led to a decrease in throughput volume. However, the drop in the volume of dry bulk and bulk cargoes was further impacted by the European Climate law which provides for complete decarbonisation in the coming years and introduction of environmental taxes on CO2 emissions.
Throughput of containers (number containers and TEU) & cars (in units)
One should also add that despite recording lower volumes of throughput, Luka Koper managed to significantly outperform other comparable ports as presented in the tables below.
Containers – TEU
| wdt_ID | Port | 9M 2019 | 9M 2020 | Change% |
|---|---|---|---|---|
| 1 | Ravenna | 167.398,00 | 147.241,00 | -12,00 |
| 2 | Venice | 445.724,00 | 394.695,00 | -11,40 |
| 3 | Hamburg | 7.000.000,00 | 6.300.000,00 | -9,90 |
| 4 | Rotterdam | 11.193.235,00 | 10.669.283,00 | -4,70 |
| 5 | Koper | 734.489,00 | 710.165,00 | -3,30 |
Cars – units
| wdt_ID | Port | 9M 2019 | 9M 2020 | Change % |
|---|---|---|---|---|
| 1 | Valencia | 541.696,00 | 364.889,00 | -32,60 |
| 2 | Barcelona | 579.533,00 | 320.830,00 | -44,60 |
| 3 | Koper | 503.653,00 | 426.107,00 | -15,40 |