This week we have witnessed events that only two weeks ago most of us thought to be impossible. War in Ukraine brought much more uncertainty to the macroeconomic puzzle which could be seen by realized volatility in financial markets. On Tuesday we saw rates falling by 20-30bps, reflecting the strongest move down in the last few decades. In this article we are presenting drivers of the move and what are the potential scenarios for the following period.
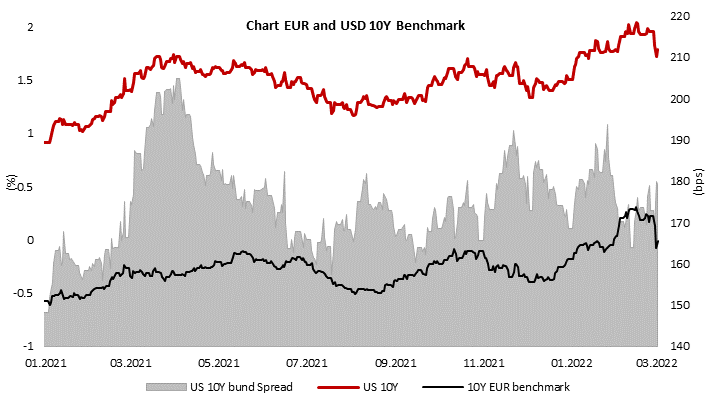
Only a month ago, our biggest challenge was to predict how many times will central banks hike their rates this year with inflation being at multi-decade highs across the globe. Major investment banks were competing which one will put more hikes in their predictions with some of them having penciled 8 hikes for US and 2 for ECB coupled with QT in US and complete shutdown of QE in euro area. Rates increased dramatically at the beginning of the year, with 10Y US rising to 2.05% and EUR benchmark hitting above 30bps. Furthermore, curves continued flattening due to scare of stagflation driven by higher rates and high inflation rates that could decrease demand. Periphery in eurozone widened significantly and bonds were one of the worst performing asset classes.
And then the situation in Ukraine escalated in a way that only a few could imagine. In the first few days of war, rates were lower driven by safe heaven flows but still it seemed like investors used all up-ticks in bond markets to clean their balance sheets before all those announced hikes. Periphery was wider, with non-eurozone countries’ spread jumping above levels seen during corona crisis. However, that changed on Tuesday this week when rates dropped like a rock, reflecting multi-sigma event. For example, yield on 10y bund fell by more than 20bps which is the largest drop since 2011, more than 5 standard deviations move. Looking at the data provided by Bloomberg, since 1990 only 4 times yield fell by more than it fell on Tuesday, but all these moves happened when yields were at much higher levels. More important, bund was once again in negative territory after more than a month. 2y German paper moved at the same pace and ended the day below -70bps. Across the Atlantic, the trend was almost the same with US 10y yield falling below 1.70%. Even more interesting move happened in European periphery, especially Italy which was one of the best performers in fixed income world this week. BTPs rallied all over and ended the day below 1.40% compared to being above 2.0% only two weeks ago. Spread between Italy and Germany narrowed by some 30bps in the same time span. CEE countries on the other side have not seen such volatility as their yields fell by “modest” 10 bps. Equity was down significantly with Dax posting -4% and erasing all YoY gains while SPX was down by a bit more than 1.0%. Commodity prices were up significantly with WTI overjumping USD 110 per barrel.
So, to summarize, it was risk-off day obviously seeing equity performance, commodities skyrocketed which will result in further escalation in inflation in Europe and the rest of the world while bonds across the world had one of their best days in years. It would be easy to say that it was pure flight to safety in case we did not see narrowing in BTPs and the rest of the periphery. We think that Tuesday’s yields move was complete mix of three forces coming in play. First one was flight to safety due to war in Ukraine obviously while second one was repricing of central banks’ moves which could be seen by move in money market futures that shaved some of the hikes forecasted only two weeks ago. Namely, market now expects “only” 5-6 hikes in US and none by ECB. We also heard from the governor of Finnish central bank who said that “ECB should not exit stimulus before gauging war impact”. The third driver of the giant move was positioning as most funds are underinvested in bonds and many of them are even short bonds which had to cover their positions.
Looking at the bund yields on Wednesday morning, it came to levels which were seen last time when no one was still thinking that ECB could hike rates this year, even to end its APP in 2022. Nevertheless, inflation is still here and it’s becoming even stronger. Yesterday’s eurozone data showed that inflation accelerated in February to 5.8% YoY compared to 5.6% being expected and 5.1% in January and it looks like this could have legs with oil being above USD 115 this morning and natural gas prices shooting through the roof. Yields rose yesterday, as some of the market participants obviously took profit while some of them remembered that there could be no luck for bonds in any scenario considering war in Ukraine.
What to take from the move in yields this week? Well, it became obvious that no fundamental data besides war is now dictating flows. However, once and we hope it will be as soon as today, war stops, fundamental data will drive markets and there will be clash between economic slowdown and high inflation rates i.e., we will most likely end with stagflation. And then the main word will once again have central bankers who will have to choose between their two mandates. Price stability and economic health.
Source: Bloomberg, InterCapital
In January 2022, the total loans of financial institutions in Croatia amounted to HRK 280.24bn, which is an increase of 1.34% YoY and a decrease of -0.02% MoM.
The Croatian National Bank (HNB) published its monthly report on the changes in the Croatian financial institutions. In it, we can see that in January 2022, the total loans of all financial institutions amounted to HRK 280.24bn, an increase of 1.34% YoY and a slight decrease of -0.02% MoM.
The largest segment, household loans, had an increase of 3.7% YoY, and 0.08% MoM. This marks the 2nd month in a row that household loans increased, starting a positive trend in 2022. Meanwhile, corporate loans recorded a decrease of -0.99% YoY and -0.32% MoM.
Corporate and Household Loans Growth Rate (YoY)
In total, loans issued to households amounted to HRK 141.6bn. This increase was mainly driven by housing loans, which increased by 8.2% YoY (or HRK 5.12bn), and 0.36% MoM (or HRK 240.8m). The Government’s subsidizing program had a positive influence on the growth of these loans. In January, they held the largest share of the household loans, at 48%. Consumer loans, which maintain 37.6% of all household loans, increased to HRK 53.3bn, an increase of 2.44% YoY, or 0.5% MoM.
The household loans growth was offset by the lower result of credit card loans, which decreased by -23.1% (or HRK -826.6m) YoY, and -15.5% (or HRK -504.2m) MoM. The 3rd largest category, other loans, decreased by -4.31% YoY, -0.45% MoM, and amounted to HRK 8.8bn. Meanwhile, overdrafts on transaction accounts, which is the 4th largest category (at 4.38% of total), decreased by -2.85% (or HRK – 182.3m) YoY, while at the same time, increasing on a MoM basis by 1.2% (or HRK 73.5m). Combined, these four segments make up 96.27% of all household loans, which is an increase of 31 bps MoM and 68 bps YoY.
Loans to Households (HRK m)
In 2021, Kraš recorded an increase in sales of 4.2%, an increase in EBITDA of 13.3% and an increase in net profit of 19.4%.
In 2021, Kraš recorded an increase in sales of 4.2% YoY, amounting to 1.1bn. On the domestic market, Kraš recorded an increase in sales of 10.8%, amounting to HRK 581.5m. Meanwhile, in the foreign markets, the company reported sales of HRK 467.1m, representing an increase of 5.1% YoY. The biggest driver in sales growth was in cacao products (+8.5% YoY), followed by the candy sector (+8.1%), flour sector (+4.6%) and cookie and waffle (+4.6%). Group increased its business activity through both higher volume sales and higher prices.
Operating expenses also noted an increase of 3.5% YoY, amounting to HRK 1bn. The highest impact on operating cost growth was reported material costs which increased by 9.4% or HRK 55.8m. This growth was partly compensated by a decrease in employee expenses by 3.6% or HRK 8.9m. As a result of the above-mentioned, EBITDA increased by 13.3% to HRK 94.7bn. Such a result shows an improvement of EBITDA margin by 0.4 p.p. to 9%.
Going further down the P&L, operating profit increased by 25.9%, reaching HRK 38.2m. This puts EBIT margin at 3.6% (+0.5 p.p. YoY). The slightly positive net financial result (compared to HRK -5m 2020) improved the company’s earnings before tax and improved EBIT YoY increase. Better net financial position occurred as the company reported much higher FX losses last year – FX loss decreased from HRK -14.2m to HRK -5.5m, noting a 61.1% decrease YoY.
In 2021, Kraš recorded an increase of net profit by 19.4%, to HRK 30m. An increase in net profit also resulted in a slightly higher profit margin of 2.9% (+0.3 p.p. YoY).
Kraš FY Key Financials