Worldwide regulated open-end fund assets decreased by 2.2% to EUR 60.6 trillion in Q4 2022 compared to Q3. In USD terms, assets increased by 7% due to the significant depreciation of the USD. Measured in local currency, the net assets in the two largest fund markets – US and Europe, increased by 5.6% and 0.9%, respectively. Further, net sales registered a net inflow of EUR 128bn, mostly on the back of money market inflow. Overall, financial markets slightly recovered during Q4 2022, but investors remained cautious – resulting in continued net outflows from long-term funds.
Looking at worldwide regulated open-end funds assets, a 2.2% decrease during Q4 2022 in euro terms can be noted. Further, the net assets in the two largest funds markets, US and Europe, measured in local currency, increased by 5.6% and 0.9% respectively. On a euro-denominated basis, worldwide equity fund assets experienced a slight decline of 0.6% QoQ and ended the year at EUR 25.7 trillion (down 14.9% on a yearly level).
Worldwide Assets of Regulated Open-End Funds [EUR trillion, end of quarter]
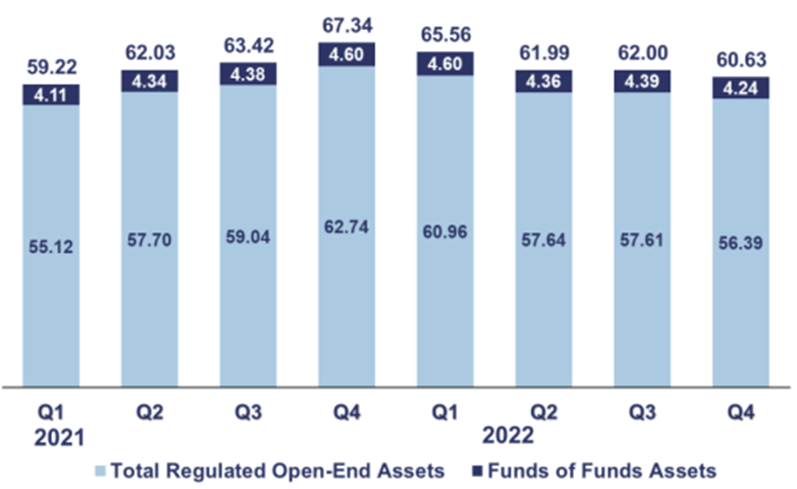
Source: EFAMA International Statistical Release, InterCapital Research
Further, worldwide investment funds registered a net inflow of EUR 128bn during Q4, compared to the net outflow of EUR 44bn during the previous quarter. However, even taking into account positive net inflow during the last quarter of 2022, overall worldwide assets of open-end funds decreased by as much as 10% on a yearly basis in Q4. This can be further observed by looking at quarterly net inflows/outflows since 2021. The picture below can give us an insight into a “shakey” sentiment and demand for open-end funds.
Worldwide Net Sales of Regulated Open-End Funds [EUR bn]
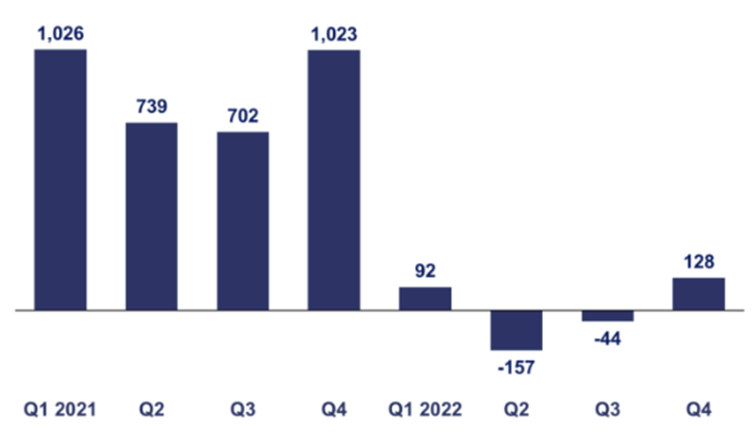
Source: EFAMA International Statistical Release, InterCapital Research
Nevertheless, it is worth looking at the mentioned net inflow of EUR 128bn during Q4 (net outflow of EUR 44bn in Q3) in more detail.
Net Sales of Worldwide Regulated Open-End Funds [EUR bn]
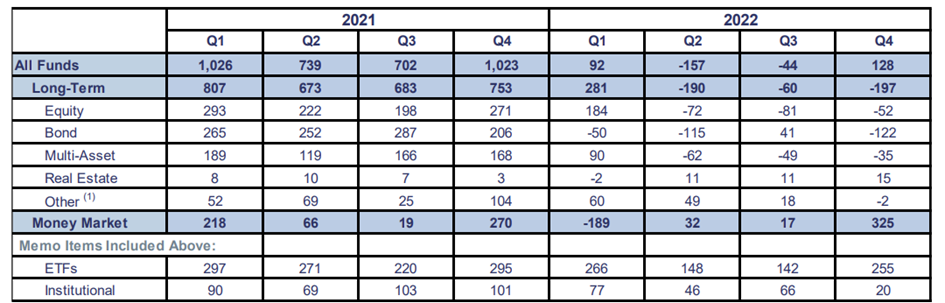
Source: EFAMA International Statistical Release, InterCapital Research
One can notice that the positive Net Sales during Q4 can be mainly attributed to the EUR 325bn inflow in the Money market, which was partially offset by an outflow from Long-Term funds, amounting to EUR 197bn (mainly Bonds followed by Equity). Overall, we can notice investors remained cautious during the quarter, which resulted in the continued net outflow from long-term funds and strong sales of MMFs – even as financial markets somewhat recovered during the quarter.
Finally, it is worth looking at Net Assets by type of Fund of Worldwide Open-End Funds
* ”Other” include guaranteed/protected funds
Source: EFAMA International Statistical Release, InterCapital Research
The latest flash estimate of the Croatian CPI shows an increase of 10.6% YoY and 0.8% MoM in March 2023. The full release is planned for 17 April 2023.
On Friday, the Croatian Bureau of Statistics, DZS, released the flash estimate for the Croatian CPI, for March 2023. According to the release, the Croatian CPI increased by 10.6% YoY, while MoM, it grew by 0.8%.
Starting off with the yearly change first, according to the main components of the index, Food, beverages and tobacco grew by 15.3% YoY, Non-food industrial products without energy by 9.3%, Services by 8.2%, and finally, Energy by 7.5%.
On a monthly basis, the largest increase was recorded by Non-food industrial goods without energy, with 2.2% growth, followed by Food, beverages and tobacco, at 1%, and Services, at 0.2%. On the other hand, Energy recorded a decline of 0.7% MoM.
Croatian CPI (February 2013 – March 2023, YoY, %)
Source: DZS, InterCapital Research
Here we can see several things developing: first of all, even though the decline on a YoY basis is encouraging, it doesn’t tell the complete story, for two reasons. Firstly, the base from which the CPI in March 2023 is compared to is quite high, as inflation in March 2022 increased by 1 p.p. compared to February 2022. If this didn’t happen, then the inflation rate right now would be higher. Also, the monthly CPI can tell us the real story, as it can show us if the inflation is slowing down or not. The 0.8% increase MoM shows us that the inflation rate is not only slowing down but is actually accelerating.
Looking at the breakdown by sectors, we can see that even though the initial growth, especially on the yearly average was driven by higher energy and food&beverages costs, right now, the story is a bit different. Energy actually recorded a decrease in prices, which given the current favorable environment in the energy market (especially compared to several months ago) is expected. However, other segments did record growth, and this even includes categories outside energy and food&beverage segment, meaning that other factors besides energy are driving the inflation rate higher. This is also a result of the prolonged high inflation, meaning costs and wages go up, and the overall prices across the economy have to go up as well. Currently, the only way central banks, and in our case, ECB can combat this is with higher interest rates, which granted, they have been doing. However, with inflation spreading widely across many segments, the increase in interest rates will not be able to affect inflation in the same way across these segments, leading to high inflation rates, even with interest rate hikes. The argument that could be made against this point is the fact that the interest rates haven’t been implemented long enough and need more time to have the desired effect. This is a fair argument, but the problem with it is the fact that as time goes by, it will be harder and harder to gauge what influence these hikes have, as multiple interest rate hikes over a prolonged period is extremely hard to pinpoint when it comes to their direct impact on inflation rates.
Span acquired 100% of shares in GT Tarkava LINKAJ. GT Tarkava is a leading Estonian company in licensing and software asset management, the segment where Span generates c. 60% of its top line. The estimated value of the transaction is EUR 11.4m with part of the purchase price depending on the business results of GT Tarkava in 2023 & 2023.
On Friday, Span published a notice of the purchase of 100% shared in GT Tarkvara. GT Tarkava is a leading Estonian company in licensing and software asset management. This represents a further expansion of Span’s main segment in deriving revenues. We note Span derives c.60% of its top line in this segment – licensing and software asset management. Further, this represents the first step in the business relationship with Span and a customer and the base for potentially providing other services available at Span. Also, the acquired company is already focused on digital transformation and cyber security projects. Finally, Span also emphasized this transaction as a solid base for further expansion, especially in high-added value segments, combined with Span’s advanced cloud and cyber security services.
The estimated value of the transaction is EUR 11.4m with part of the purchase price depending on the business results of GT Tarkava in 2023 & 2023. With this acquisition, Span entered the Estonian market, one of the most digitally developed countries in Europe. This confirms Span’s strategic course to further growth and expand to new markets.
Span key financials (2022 vs. 2021, HRKm)
Source: Span, InterCapital Research