Today we bring you a brief analysis of the total market capitalization of listed companies as a % of GDP in countries from the region.
The market cap to GDP ratio, or the Buffet Indicator as it is sometimes referred to, due to the fact that it was popularized by the famous investor Warren Buffet, compares the market capitalization of all publicly-traded stocks on a single market with the country’s GDP. It was one of the indicators of the approaching storm and later the crises in 2008, which severely damaged the equity markets. As Buffett said, “The ratio has certain limitations in telling you what you need to know. Still, it is probably the best single measure of where valuations stand at any given moment” so it is often used to determine whether the stock market is overvalued or undervalued.
The historic GDP data were taken from Eurostat, while market caps were taken from the statistics published by regional stock exchanges and Bloomberg.
Source: InterCapital Research
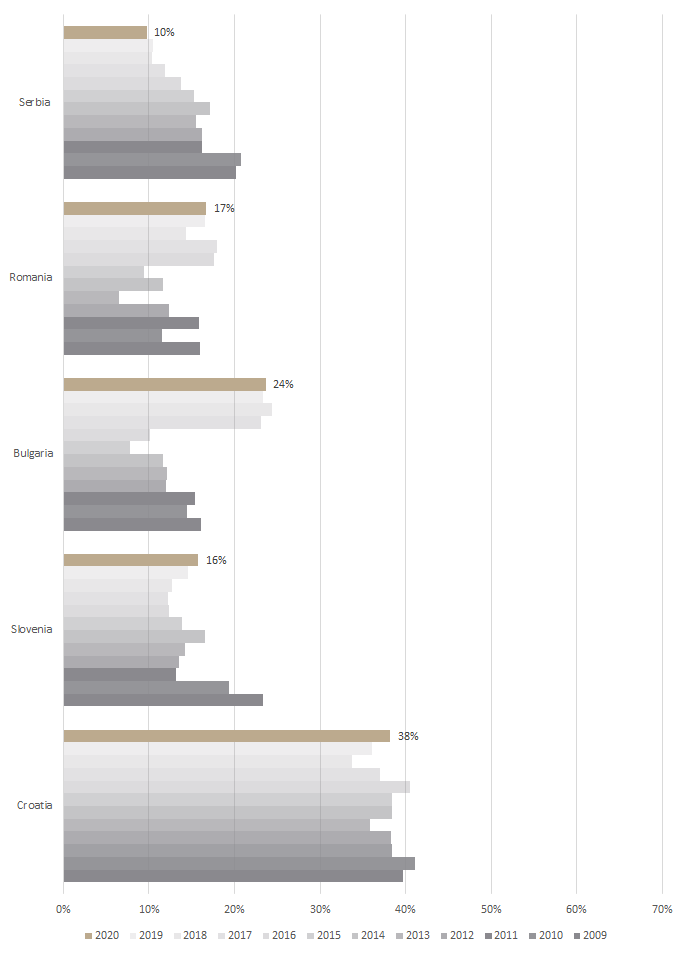
Among the observed countries, Croatia comes on top with the largest market cap to GDP ratio which amounts to 38%. As one can notice from the chart, the ratio actually increased despite the COVID-19 pandemic which caused Croatia to experience the deepest economic contraction since 2009, with GDP decreasing by 8.4% YoY. As a result, the current market cap to GDP ratio increased to 38.2%. However, if we were to look at free float market cap to GDP we would observe a relatively low ratio of 15.7%.
Slovenia was relatively less affected by the pandemic Covid-19 with the economy contracting by 5.5% in 2020. Meanwhile, Slovenian blue chips showed strong resilience to the pandemic with the equity market cap of LJSE decreasing by only 2.1% in 2020. At the moment, the market cap to GDP stood at 15.7%, the highest level since 2014.
Meanwhile other countries from the region have been posting a similar ratio for the past several years. However, one should note that when compared to the pre 2008 era, most of the observed stock exchanges are barely reaching half of their level.
Although one should never look at a single parameter when determining whether a market is under or overvalued, it seems that the according to Buffet’s indicator both countries might have plenty of room for growth in equities.
Where are we when compared to other countries?
When comparing regional stock exchanges to some of the World’s largest stock exchanges one can notice that there is still plenty of room for growth. Namely, all regional stock exchanges are significantly below the average when compared to the German or USA market. However, one should take into consideration that those stock exchanges have a significantly higher level of liquidity which can partially explain the large discrepancy.
In Q4, total revenues from internet access services reached 1.22bn, representing an increase of 5.3% YoY.
HAKOM has recently published ICT market data for Q4 2020 in Croatia. According to the report, total revenue from telephone services in fixed public communication network amounted to HRK 276.05m, representing a decrease of 7.2% YoY. Of that, retail sales account for the vast majority (HRK 243.5m), which noted a decrease of 4.1% YoY.
Total revenue from telephone services in the mobile public communications network in Q4 of 2020 reached HRK 1.067bn, representing a slight decrease of 1%. Such a decrease came from retail sales which witnessed a decrease of 3.3%. Within the segment, private users observed a slight increase of 0.7% to HRK 663.85m. On the other hand, corporate users noted a decrease of 14.1% to HRK 208.7m. Meanwhile, wholesale revenues amounted to HRK 195.2m (+10.73%). As of Q4, the number of users within the mobile public communications network somewhat decreased (-0.66%) to 4.38m.
Total revenues from internet access services reached 1.22bn, representing an increase of 5.3% YoY. Of that, revenue from Internet access via mobile network observed a strong increase of 16.1% and amounts to HRK 756.5m. At the same time, revenue from Internet access via fixed network noted a decrease of 8.5% to HRK 461.3m.
Total revenues from television services observed an increase of 2.8% to HRK 207.8m, while the number of pay TV subscribers reached 851k, noting a similar increase (+2.5%). IPTV users were up 1.7% YoY to 444ths, while cable TV users were up 2.1% YoY to 180ths. On the other hand, satellite TV users decreased 1.1% YoY to 145ths.
At the current share price, dividend yield is 5.4%. The ex-dividend date is 2 June 2021.
Electrica published a document in which they proposed a dividend of RON 0.73 per share. At the current share price dividend yield is 5.4%.
Note that the ex-dividend date is 2 June 2021. The dividend is subject to approval at the GSM, which will be held on 28 April 2021.
In the charts below, we are bringing you Electrica’s historic dividend pay-out and their dividend yield.
*compared to the share price a day before the dividend proposal