Having read many equity research reports (valuations), from time to time you tend to see some analysts attribute an illiquidity discount in their valuations to adjust for the above-mentioned fact. However, this is where an important question arises – how was this discount determined? In today’s blog, we will point out a couple of challenges with the estimation of such a discount.
Both the Croatian and Slovenian equity market face an ongoing challenge – relatively low liquidity. To be specific, for the past decade the average daily turnover on both ZSE and LJSE has been quite stagnant, or even slightly decreasing, with a few exceptional years (sell-offs, acquisition speculation etc).
Having read many equity research reports (valuations), from time to time you tend to see some analysts attribute an illiquidity discount in their valuations to adjust for the above-mentioned fact. However, this is where an important question arises – how was this discount determined? In today’s blog, we will point out a couple of challenges with the estimation of such a discount.
In estimating the illiquidity discount one can choose between:
- Adjusting the discount rates and using a higher discount rate for illiquid companies
- Estimating the illiquidity discount by looking at comparable companies
- Estimating the value of the asset as if it were a liquid asset and then discount that value for illiquidity
In today’s blog, we will only be dealing with the last point.
Let’s start with the obvious – how we define illiquidity will determine how we calculate the aforementioned discount.
One way to define it could be as buyers’ remorse – the cost of reversing an asset trade instantaneously after you make the trade. Having said that, every publicly traded share is to some extent illiquid, which could be determined by its bid/ask spread. Intuitively, less liquid shares tend to have a larger bid/ask spread, and vice versa. Therefore, in order to calculate such a discount for ZSE and LJSE we looked at the weighted bid/ask spread for their respective equity index (CROBEX10 and SBITOP). For this, we looked at the average 1 year bid-ask spread of each constituent in the index. By doing so we reach a conclusion that the average 1y bid/ask spread for CROBEX10 is 0.67%, while for SBITOP it is 0.79%. However, we note that such a discount should not be mistaken with the illiquidity discount used in equity valuation. Furthermore, such a discount would be significantly higher in case 17 companies did not have a market maker.
Another way to look at an illiquidity discount on the regional markets is to think of it as an impatience discount. In order to clarify the mentioned, one must be aware that the regional markets are mostly block markets for institutional investors, meaning that larger players can exchange shares on ZSE and LJSE above HRK 2m / EUR 270k without moving the market price. However, let’s suppose one would like to instantly enter or exit a large position that isn’t sufficient for a block transaction, for ex. slightly lower than HRK 2m on ZSE. In theory, such a decision would be done only due to opportunity cost or significant fundamental undervaluation. A patient investor may reduce the previous two components of investing cost by waiting to trade. However, the risk is that the “future price” will not be as attractive.
We stress that such a situation is mostly theoretical as, on the regional market, such a decision would definitely lead to a relatively large price movement on almost all stocks. Therefore, the extent of such a price movement could also be seen as an illiquidity discount. If we were to look at the weighted price move for SBITOP constituents last week, one would have to move the index by 12.57% to sell a large position (slightly below EUR 270k for each constituent weighted by index weight) immediately, or 14.6% to buy a large position in the index. Turning our attention to CROBEX10, one would move the index by 21% to sell a large position (slightly below HRK 2m), or +11.6% to buy a large position in the index. However, in order to calculate the illiquidity discount, we would rather look at the volume-weighted average price (vwap) of the above mentioned. The average of those vwap movements (both bid and ask) could in theory be seen as an illiquidity discount for the market, that being 5.6% for CROBEX10. Calculating the same for SBITOP would give us a discount of 3.47%.
However, such a calculation does come with a couple of challenges. First of all, to calculate such a discount one would have to retrieve the data of the orderbook of all index constituents for a longer period of time to actually conclude whether the above-stated discount varies over a longer period. Secondly, last week’s orderbook indicated that one cannot actually acquire just slightly below HRK 2m or EUR 270k for most Croatian and Slovenian Blue chips, but actually a lower amount. This could indicate that above-stated discounts might actually be understated. Besides that, attributing a unified discount for different shares might give us misleading conclusions.
Therefore, it might make sense to actually see what are the drivers of illiquidity of each individual stock before attributing a company-specific discount. This can be done by taking into consideration certain parameters and then running a regression against the bid-ask spread. If we were to look at the CROBEX components one can notice a positive relation with a higher spread and a lower market cap, lower average daily turnover, lack of a market maker or a lower free float. Therefore, if we can determine the mentioned for one company, we could “reverse engineer” its expected spread, that being the illiquidity discount. The issue with such an idea on the regional market is a relatively low sample size which does not provide us with a statistically significant regression. Thus, we might take into consideration the above-mentioned parameters, but would not be able to quantify the discount, at least not in a statistically meaningful way.
Our view
Based on our research we find that illiquidity discount in most blue chips should be in the 5-15% range. We support our notion that CROBEX and SBI TOP are historically significantly cheaper (on multiples) than developed markets.
Of the 20 observed indices, SBITOP tops the list with a YTD increase of 33%.
2021 could be considered as a very solid year for equities both in the region and globally. With very solid performances of SBITOP and CROBEX, we decided to take a look at how does this performance compare to major European and global indices. For this, we looked at 20 selected equity indices.
As visible from the table, 15 out of 19 indices noted a double-digit increase while Slovenian SBITOP leads the list with a YTD increase of as much as 30.61%. Note that the index has seen a slight decrease in the past 1 month (-1.8%), following the Evergrande crisis, which led to a slump in all major equity indices. Croatian CROBEX also noted a very solid increase of 13.6%, despite being heavily reliant on the tourism sector, which has been significantly affected globally since the outbreak of the pandemic.
On the flip side, the only 2 indices (of the observed ones) to note a YTD decrease was Hang Seng, which noted a decrease of -11% and Bist100 of -6.2%.
YTD Performance of Selected Indices
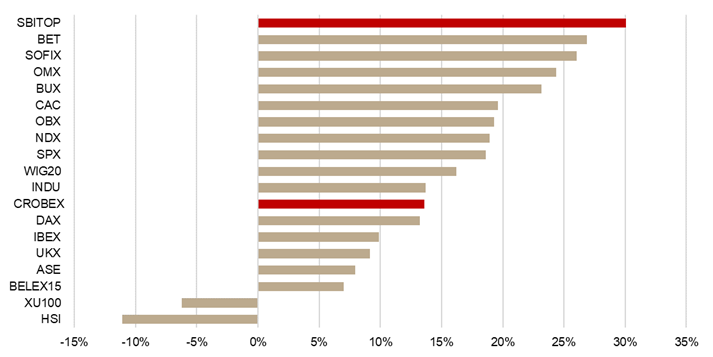
Source: Bloomberg, InterCapital Research