The product tanker company Tankerska Next Generation published FY results, showing a 23% drop in EBITDA and 81% drop in net income. 2018 was a weak year for the entire shipping market, and TNG managed to record a TCE rate of USD 13,201 a day (-15%).
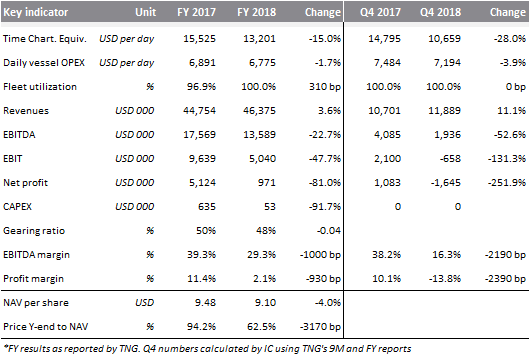
Tankerska Next Generation reported a sharp drop in financials in 2018, owing mostly to the fact that the spot rates were not high enough to replace the expired time charters. Out of 6 ships, 3 entered 2018 with previously arranged time charters. Vukovar expired in April (TCE of USD 17,250 a day), Zoilo in July (17,750) and Dalmacija in September (17,750). Excluding these previous arrangements, according to our calculation it seems that TNG had a TCE of about USD 9,500 a day in 2018. It looks like arranging a time-charter for Vinjerac at 14,500 in Q1 2018 (until Q2 2019) was a good call.
The results can be attributed to the fact that 2018 was a weak year for the tanker market. According to Morgan Stanley’s Maritime Report, the average MR2 clean Spot (average 6 routes) per quarters of 2018 in thousand USD was 10.3, 8.2, 6.5 and 10.9. The average for the year was 9.0. It stands at 12.4 YTD. TNG’s management says this recent improvement can be attributed to the overlap of increased transport demand (OPEC, US and Russia gradually increasing production) and somewhat increased phasing-out of older vessels.
Charter Rates According to Morgan Stanley’s Maritime Report
In 2018, TNG reported a 4% increase in revenue, but this positive movement was exclusively due to the fact that more vessels are operating on the spot market (in this case TNG covers fuel, port and some other costs associated with voyages so they charge a higher price compared to time charters). The movement of TCE (-15% to USD 13,201 a day) gives a more comparable number to 2017. This lost TNG an absolute amount of USD 4.0m and was almost completely transferred to EBITDA as there were only minor savings in Vessel operating expenses and G&A (relatively G&A is down 6%, but their absolute positive impact is less than USD 0.1m). D&A remained unchanged, but an impairment of Dalmacija (by USD 0.6m or 2% of the vessel’s book value) pushed EBIT further down. Net income ended at USD 1.0m, down by 81% or USD 4.2m (slightly helped by lower interests and better FX).
We wouldn’t expect much dividends this year due to low net income, risks related to having most fleet on spot and future CAPEX requirements (related to sulphur emissions and ballast water management).
At the current share price, the dividend yield would be 3%. Ex-dividend date is 15 May 2019.
Valamar published a document in which they state that their Supervisory Board established the proposal for dividend payout in the amount of HRK 1.00 per share. Note that the ex-dividend date is 15 May.
At the current share price, the dividend yield would be 3%, which is higher by 0.74p.p. compared to the year before. Also note that in the observed period this would be both the highest dividend per share and dividend yield.
Dividend Per Share (2015 – 2019) (HRK)
Dividend Yield (2015 – 2019) (%)*
*compared to the share price a day before the dividend proposal
In 2018, Sphera recorded an increase in sales of 24.6%, increase in EBITDA of 13.2% and an increase in net income of 4.5% (vs pro forma 2017).
As Sphera published their 2018 preliminary results, we are bringing you some key takes from the report. According to it, in 2018, the Group recorded sales of RON 771.2m, which represents an increase of 34.5% YoY. The rise in sales could mostly be attributed to a growth in the sales of USFN Romania (KFC restaurants) whose contribution to the growth was 18.1p.p. ARS follows, with a contribution of 9.8p.p. to the sales growth. Note that, compared to the 2017 pro forma statement, sales increased by 24.6% (as the pro forma statement includes the full year performance of ARS in 2018).
Sphera Sales (2015 – 2018) (RON m)
When observing the Group’s expenses, they increased by 39%, amounting to RON 668m. Such an increase could be mainly attributed to a rise in food and material expenses by RON 68.8m and an increase in payroll and employee benefits by RON 52m. Both accounted for 25 p.p. of the increase in expenses.
In 2018, Sphera recorded an EBITDA of RON 62.3m which is a 21.2% increase. Note that such an increase could also be attributed to a rise in depreciation and amortization of RON 6.5m (+46.7%). C
When observing the Group’s net income, it reached RON 34m, which represents an increase of 8.3%, while compared to the 2017 pro forma statement, it increased 4.5%
Sphera EBITDA & Net Income (2015 – 2018) (RON m)
In January 2019, Monbat AD recorded an increase in revenues of 8.7%, increase in EBITDA of 41.3% and an increase in EBT of 78.6%.
As Monbat Group published a brief overview of their January 2019 results, we are brining you some key takes from the it. In January, Monbat generated net sales revenues of BGN 28.9m, which represents an increase of 8.7% YoY. Of that, Production accounted for BGN 26.5m, which represents 92% of the total sales.
The Group reported EBITDA of BGN 3.8m which represents an increase of 41.3% YoY.
Meanwhile EBT amounted to BGN 2m, representing an increase of 78.6%, compared to January 2018.