As uncertainty on financial markets escalates, with a possibility of a recession looming, we decided to see how the Croatian and Slovenian blue chips in the current period compared to the previous crises since 2007.
In order to do this comparison, we looked at two variables for Croatian and Slovenian blue chips; price change and revenue change. We analyzed how these variables changed during the Global Financial Crisis (GFC) of 2008, the recovery in 2009, the beginning of the Europe Debt crisis in 2010/2011, the recovery period in 2014/2015, the COVID-19 pandemic, and the 2021 recovery, as well as in the current period. These periods were selected based on the strongest impact of these crises on the economic output (GDP) in Croatia and Slovenia.
Firstly, looking at the Croatian data:
Table 1. Croatian blue chips price change in select periods* (2007 – present day)
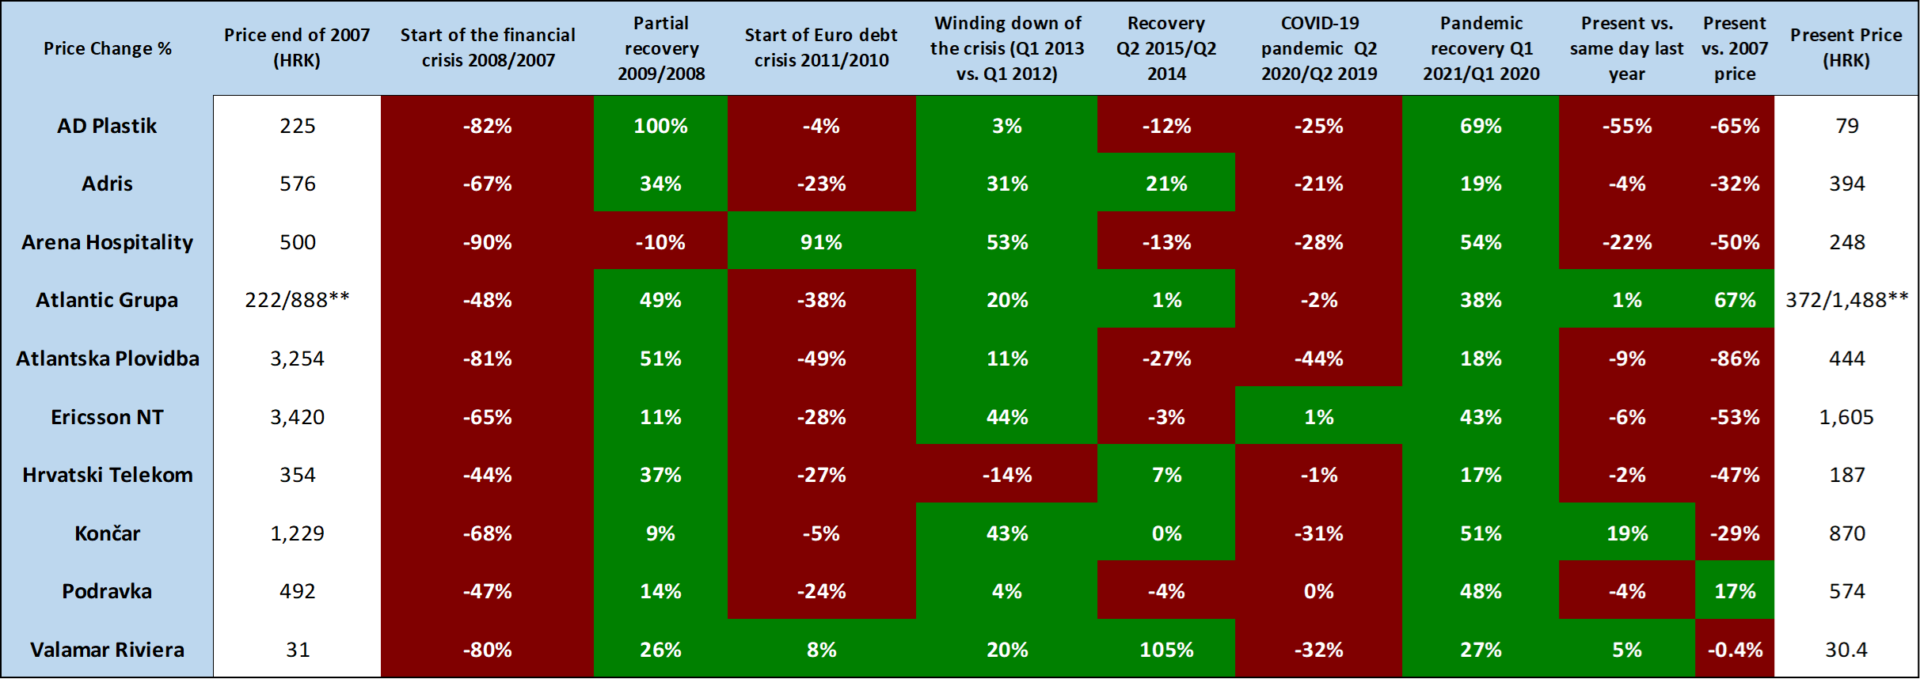
Source: Bloomberg, InterCapital Research
*Share prices have been adjusted for the stock splits in the period
**Atlantic Grupa price before and after the 4-1 stock split
Table 2. Croatian blue chips revenue change in select periods (2007 – present day)
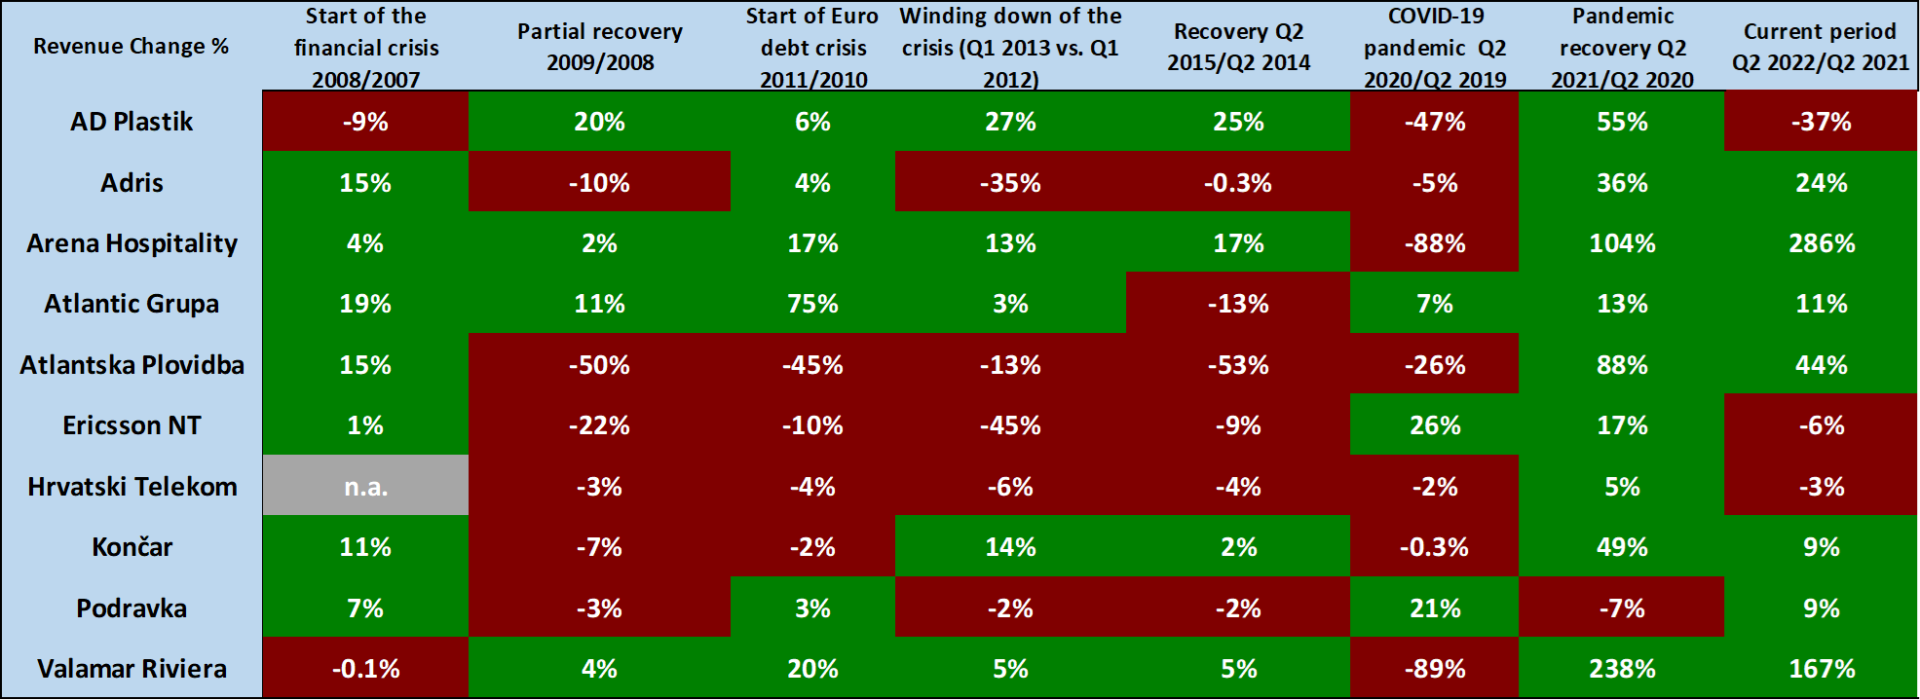
Source: Bloomberg, InterCapital Research
Next up, the Slovenian data:
Table 3. Slovenian blue chips price change in select periods* (2007 – present day)
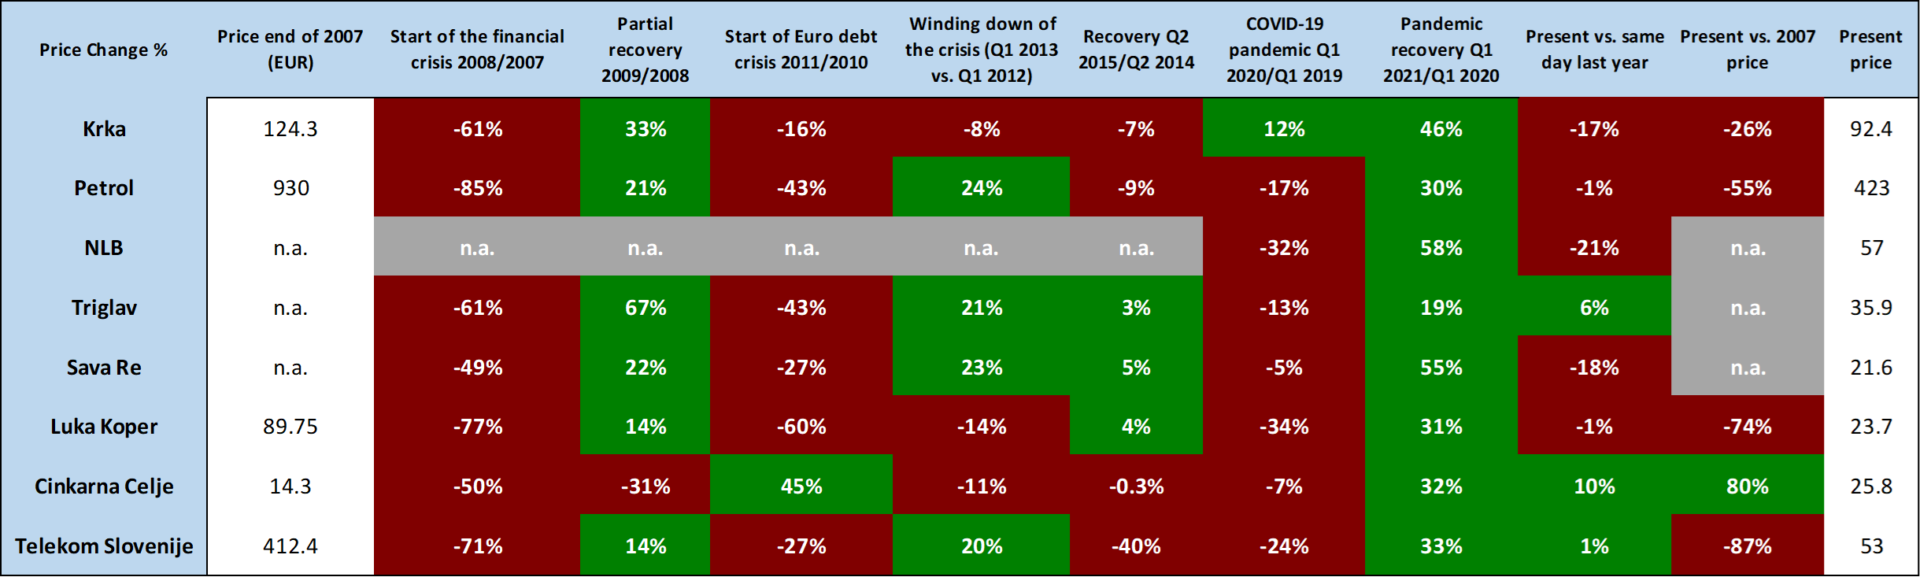
Source: Bloomberg, InterCapital Research
*Share prices have been adjusted for the stock splits in the period
Table 4. Slovenian blue chips revenue change in select periods (2007 – present day)
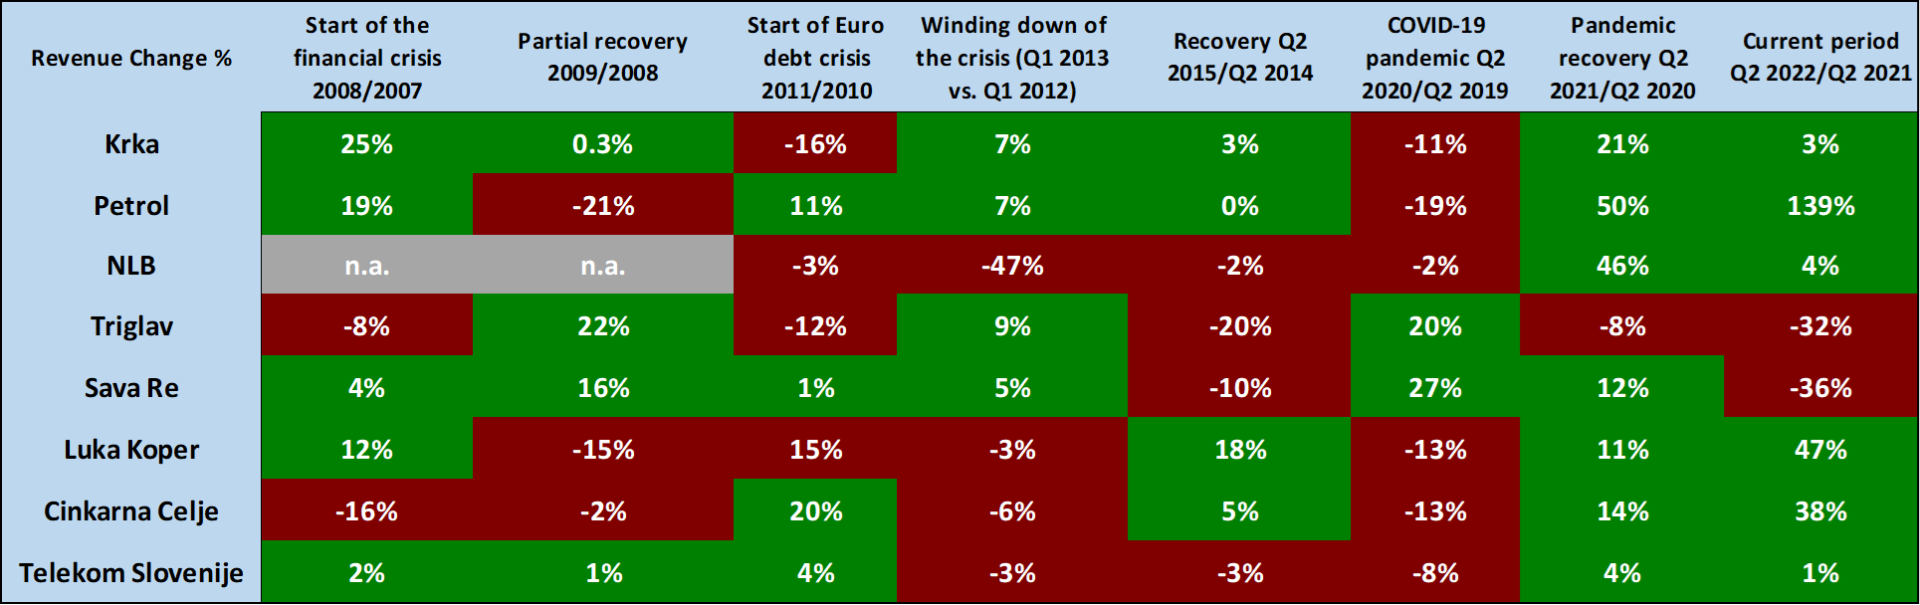
Source: Bloomberg, InterCapital Research
We looked for similarities and differences between the periods presented. By looking at the data presented, we drew a few conclusions, and here are their main determinants:
Every crisis is distinct
Just looking at the exact economic output data for Slovenia and Croatia in different periods would not make sense without taking it into context. The current period shows signs of great uncertainty and a strong possibility of a future recession in Europe which includes the presented regional markets of Croatia and Slovenia. So if there would be a recession, it would be markedly different than any crisis preceding it. This is because this time around the macroeconomic situation is different. Companies and citizens are on average fairly low-leveraged and consumer spending and savings are still quite high. On the other hand, the geopolitical situation is completely uncertain, and turning for the worse is also an option.
Industries react in different ways
Because of the different macroeconomic environments, some industries are a lot more resilient to outside shocks, while others are quite cyclical and hit harder during times of crisis. This is because they are highly dependent on the economic period, or rather, during an economic expansion, they grow faster, while during economic downturns, they are hit harder. If we also account for the fact that each company is a specific entity with various levels of indebtedness, capital strength, market shares in their respective markets.. etc., then crises that are driven by dissimilar factors will affect them differently. Examples of these industries can be pharmaceuticals, insurance, and telecommunications. On the other hand, industries like the tourism industry are severely affected by economic downturns. Here we can also see the specificity of a crisis; the COVID-19 pandemic had a way higher impact on the tourism industry than other crises (except for the financial crisis of 2008 when everything declined severely.)
Stocks were overpriced in 2007 – most never managed to recover
As time passes and economies and companies grow, one would expect that their stock price would also follow suit, especially considering that neither Slovenia nor Croatia has fast-growing companies like the ones in the technology sector. This is especially true if we consider that the blue chips in these countries can be considered “value” companies. However, if we look at the levels these companies had in 2007, we can see that besides several exceptions (Atlantic Grupa, Podravka, Cinkarna Celje) most of the companies have lost some, if not significant value. In fact, there are more Slovenian (with the exception of NLB, Triglav, and Sava Re) and Croatian blue chips that lost more than 50% of their value compared to the end of 2007, than not. This is especially worrisome if we consider the fact that the majority of these companies are quite different than they were back then, with some expanding to new markets and making acquisitions that increased their revenue significantly, but still not managing to reach their 2007 level.
There are several reasons for this. First of all, back then, the markets were a lot less regulated than they were now. Secondly, there was a lot of excess liquidity on the markets, especially in Croatia, looking to flow more into the capital back then. This also ties into the issue of a decrease in turnover on the Ljubljana, but especially Zagreb Stock Exchange in the last decade (of which you can read more here). Finally, because the end of 2007 was the height of one of the largest bubbles in the world, but also the region when the bubble popped with the start of the crisis, it wouldn’t even be logical to expect that the companies would go to those levels again. However, even if the companies did not manage to reach their 2007 prices, the value could still be achieved through dividend payments. For example, in 2022, the dividend yield of CROBEX10 amounted to 2.6%, while for SBITOP, it amounted to 6.5%. This would mean that if we take those dividends into account over the entire time period, companies would have higher returns than they lost compared to 2007 even if they did not reach those price levels again.
Revenue lags behind the price
As is to be expected, the sentiment on the market and the bleak economic outlooks have a far greater immediate impact on investor confidence (and thus price) than they do on the fundamentals of the companies. In fact, if we look at data for both Croatia and Slovenia, during the 2008 GFC, the majority of the blue chips experienced revenue growth, even in the period of the largest decline in prices. However, in the period afterward (2009), somewhat of a reversal happened; share prices recovered but the revenues declined or were below their potential growth. Considering that the Euro Debt crisis happened immediately after the GFC, the effect on revenue was mixed; while prices declined. The only outlier in this regard is the COVID-19 pandemic, which by the end of Q2 2020 demonstrated both the decline in revenue and share price. The recovery afterward, however, was even swifter in terms of prices but was somewhat lagging in terms of revenue. This brings us to the current period, which can be seen as a direct result of the pandemic or the global response to it. This period is marked by a huge surplus of liquidity on the market due to still high levels of Government bonds in the central bank’s accounts. The high level of commodity prices is a direct result of the war on European territory and the placement of sanctions on Russia, while inflation of all products and services from the basket of goods used in everyday life is a snowball result of all of this. So all these reasons (QE, commodity price growth, inflation..) are the main drivers of the future recession.
We are not there (yet)
Finally, comparing the current period to any of the past crises is quite hard, mostly because for these periods we had the full data. Take for example the fact that for the past crises, we knew when they started, what their causes were, when was the height of the crisis, how long they lasted, what measures were used to bring them under control, etc. This means that the most we could say is that we are currently in a “lull before the storm”, and even more complicated, a storm that is only potentially coming. If the recession period were to happen, it’s in the future, so the worst effect of it would also be in the future.
However, it should be noted that even though there are a lot of pressures that are pointing toward this happening, such as high inflation rates, high energy prices (especially in Europe), and the potential for further escalation in Ukraine and thus further deterioration of macroeconomic and geopolitical conditions, there are also indicators that point towards the opposite. Take for example, during the previous crises, overleveraged companies, banks, and countries played a crucial role in causing or exacerbating the recession. In the current period, however, companies’ capital structures, for the most part, are much healthier than they were in most of the previous crises. Debt levels are lower than they were at any of those periods too; banks are also maintaining a lot of capital reserves, especially in Europe. Furthermore, any long-term inflation and energy pricing pressures should be mitigated within the next 2 years, as measures are used to combat both (interest rates in terms of inflation, new sources of fuel in terms of energy). Also, unemployment rates are at low levels, and there are situations in certain industries where there is even a lack of labor, such as the construction, or the hospitality industries. Even if we use the most common definition of a recession, i.e., 2 quarters of GDP decline, neither Slovenia nor Croatia fit this. In reality, both countries recorded solid GDP growth in Q1 and Q2 2022. Finally, if we look at even the most immediate respondents to any negative news, i.e., the capital markets, we can see that the majority of the companies are staying close to the prices they had in the same period last year. The only notable exception to this is AD Plastik, which was severely affected by the semiconductor shortages and the war in Ukraine.
What can be taken away from all of this? Firstly, the Croatian and Slovenian blue chips are quite resilient to the current shocks, in terms of their share prices. Revenues are also growing steadily, but this is also under the influence of the increase in prices that the companies did to offset higher prices. Compared to any of the previous crises then, one could say that we aren’t even close to any of the worst periods. However, even if the current macroeconomic indicators (GDP, unemployment rate to name a few) are holding strong against the shocks, the inflationary pressures and the geopolitical uncertainty that fuels them will certainly push Europe towards a recession, especially if the situation in Russia escalates further.
By the end of August 2022, the NAV of Croatian Mandatory Pension Funds amounted to HRK 132.5bn, an increase of 0.1% MoM and 2.9% YoY.
The Croatian Financial Services Supervisory Agency (HANFA) has published its monthly report on the changes in the Croatian mandatory pension funds. The NAV of the pension funds grew to HRK 132.5bn in August 2022, which is 0.1% higher on a MoM basis and 2.9% higher on a YoY basis. Meanwhile, net contributions into these funds amounted to HRK 705.5m in August, whilst they amounted to HRK 5.4bn since the beginning of the year.
Mandatory pension AUM structure change (HRKbn, January 2018 – August 2022)
Bonds’ increase of 0.2% MoM (or HRK 205.5m in absolute amount) and an increase of 4.3% YoY (or HRK 3.5bn) mostly contributed to the growth of NAV. Meanwhile, shares increased by 0.8% MoM (HRK 205m) and 2.1% (547.5m) YoY. Investment funds noted a decrease of 1.1% on a MoM basis (HRK 154.4m), but an increase of 2.4% on a YoY basis (HRK 325.5m). The next asset class, deposits and cash experienced a decrease of 3.3% MoM (or HRK 159.9m) and a 13.7% (or HRK 742.4m) YoY decrease. On the other hand, receivables grew by 60.2% MoM (or HRK 457.5m) and increased almost 10x (an increase of HRK 1.1bn), amounting to HRK 1.2bn. Lastly, we have the money market which also grew on a MoM basis by 17.4% (or HRK 155m), but decreased by 20.7% (or HRK 273m) on a YoY basis.
Looking over at the asset structure of the pension funds, bonds still amount for the vast majority of the total, currently at 64.7%, which amounts to HRK 85.7bn, an increase of 0.07 p.p. MoM and 1.1 p.p. YoY. The second largest asset class, shares, hold 20.4% (HRK 27bn) of the total, and have increased 0.13 p.p. MoM, but decreased 0.1 p.p. YoY. Following them, investment funds, with 10.7% (or HRK 14.2bn), a 0.13 p.p. MoM decrease but an unchanged YoY.
Current mandatory pension funds AUM (August 2022, %)
Dividing the holdings into domestic and foreign holdings, we can see that domestic bond holdings amounted to 92.5% of total bond holdings, while foreign bold holdings make up the other 7.5%. At the same time, domestic equity holdings account for 60.7% of the total and foreign equity holdings account for the rest of it, 39.3% of the total.