Krka published their preliminary FY 2023 results yesterday, showing a 5% YoY increase in sales, a 3% YoY increase in EBITDA and a 14% YoY decline in net profit (to EUR 311.2m). Overall, the estimated net profit is in line with our expectations. Further, Krka published its plans for 2024 with estimated sales amounting to EUR 1,850m and net profit of app. EUR 310m. Looking at strategic objectives, dividend policy remains unchanged with at least 50% payout ratio allocated for dividends.
Krka announced preliminary 2023 results stating that its sales have amounted EUR 1,806.4m, realizing an increase of 5% YoY, which is also the Company’s best-recorded sales result so far. Further, the Company’s EBITDA has increased by 3% YoY, while the bottom line is has decreased by 16% due to the high-base effect, as one-off impact from FX gains materially impacted the previous year. Results were amplified by the appreciation of the rouble during the time period. Rouble appreciation impacted the inventories valued in the Russian rouble, which were later sold at much higher quantities, resulting in higher-than-expected EBITDA and net profit.
Overall, we note that the expected net profit of EUR 311.2 is in line with our expectations.
Krka Key Financials
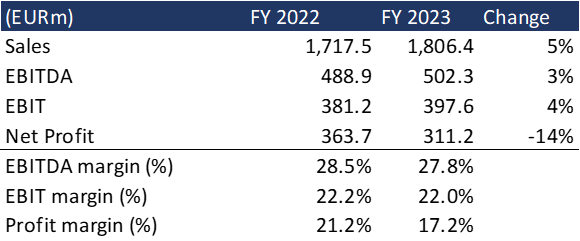
Source: Krka, InterCapital Research
When looking at the revenue by markets, Region East Europe remains the largest market, accounting for 33% of the Company’s total sales and decreasing by 5% YoY. Russia, the largest individual market in the region, generated sales revenue of EUR 346.8m, representing a decrease of 10% YoY. However, expressed in roubles, sales grew by 15%! The difference comes from negative FX difference due to rouble depreciation. Sales growth was also recorded in all other markets in this region with the exception being Ukraine and Turkmenistan. In Ukraine, sales decreased by 12% compared to FY 2022. Sales increased in all sales regions apart from Region East Europe.
The Region Central Europe, which is composed of the Visegrad Group and the Baltic states, had a sales revenue of EUR 397.1m, which makes 22.1% of total Krka Group sales. This represents a 9% increase YoY. Poland, which is the leading market in this region, generated EUR 180.8m in product sales, growing by 8% YoY. Further, in West Europe, where a total of EUR 369.6m was generated, Germany generated the strongest sales with 20% YoY growth! Germany is followed by the Scandinavian countries, Portugal, Italy and UK.
Region South-East Europe recorded sales revenue of EUR 249.3m, contributing to 13.9% of the Company’s total sales, and growing by 11% YoY. In Slovenia, sales amounted to EUR 113.8m, accounting for 6.3% of total sales, and increasing by 10% YoY. Lastly, we have Overseas markets, which experienced the largest relative increase of 14%, growing to EUR 75.2m.
EBITDA amounted to EUR 502.3m, representing an increase of 3% YoY. This growth in EBITDA can be attributed to the mentioned growth in Krka’s top line. Meanwhile, the EBITDA margin declined to 27.8% from 28.5%.
Investments
Looking over at investments, CAPEX in 2023 amounted to EUR 131.2m and it is expected to increase further in this year to >EUR 150m. Some on the completed projects during this year were system & equipment upgrade in few production capacities. The investment has decreased water-soluble organic solvent emissions. Development and Control Centres were refurbished, resulting in additional laboratory space. A new filing life was fitted in capacities in Novo Mesto. Several investments remain ongoing, some of them being the renovation of the Notol plant, where packaging lives is also being replaced and upgraded. Further, Krka increased overall production capacities for granulation and packaging. Krka is also extending its microbiology laboratory.
New Marketing Authorizations
In 2023, Krka was granted marketing authorizations for 14 new products, out of which 10 were prescription pharmaceuticals, two were animal health products, and two products belong to self-medication products and food supplements.
Plan for 2024
According to the Management’s outlook, the Company estimates a sale revenue of EUR 1,850m and a net profit of app. EUR 310m in 2024. The development is in line with our expectations. The Company also plans to allocate >EUR 150m for CAPEX in 2024 and an increase in the number of employees by 3%.
Krka FY 2024 Plan [EUR m]
Source: Krka, InterCapital Research
Key Strategic Objectives 2024 – 2028
Finally, Krka published it’s strategic objectives for the period 2024 – 2028. The Group expects for its sales to increase with a CAGR of 5% and expects to remain the leading generic pharmaceutical company in individual markets. Further strengthening and optimisation of the vertically integrated business model is in plan, as it proved to be an effective strategy guideline and allowed comparative advantage. Further, focus is on maximising the long-term profitability with the expected average EBITDA margin of at least 25% is one of the key strategic objectives. Group also plans To increase outsourcing in the development and production of selected APIs and finished products. Finally, Group wants to ensure growth through long-term partnerships and targeted acquisitions in addition to organic growth. The primary goal is to increase sales by entering new markets and adding new products. 10% of revenues is expected to be allocated to R&D. Dividend policy remains unchanged, with the dividend payout ratio of at least 50% of the net profit being allocated for dividends.
Joint venture in India
Lastly, Krka informed public of the establishment of a joint venture in India, where Krka will hold 51% and Laurus from India 49% share in the JV. The registered capital of the newly founded company amounts to EUR 50m. The purpose of the company is primarily to produce and sell in markets where Krka and its partner Laurus are not yet present. We note that Laurus employs 6,500+ people and this year (reporting period ending at 9M 2023 due to a different reporting timeline compared to Slovenia) achieved sales of EUR 669m, while achieved net profit amounted to EUR 87m.
The operating results for profit are in line with our expectations, while the revenue decline in Russia in 4Q is above our expectations. In general, we believe that very good business results were achieved because the growth of income in all other regions and new markets is significant in 2023, which we consider a great success. The joint-venture in cooperation with an Indian supplier will enable them to better penetrate Indian market, which has a very high potential. The revenue growth of the entire Krka is higher than we expected at the beginning of 2022, when the conflict started. The exchange rate of the ruble against the euro will always have an impact on Krka’s operations, given that Russia is the largest market in terms of size of all the countries where Krka sells. But Krka is a domestic producer there and 75% of the products sold on the Russian market are produced there, and the import of medicines is not a segment that is under sanctions. We do not expect significant fluctuations in the ruble exchange rate this year, except in the case of unforeseen events, so we expect that Russia will remain an important market for Krka in 2024 as well. We consider the projection of the company’s own management’s results for Krka in 2024 to be conservative and under the influence of the current decline in revenue in Russia in Q4 (-36% YoY). The management expects a profit of EUR 310m for 2024, while we believe that there is a possibility of achieving even higher net profits in 2024. We consider generic pharma sector to be a good place for investment at the beginning of this year.
During 2023, Podravka was the only company to outperform the CROBEX10 index in terms of the number of days. In this quick overview, we bring you the details of why this happened, and why it might not seem as bad as it sounds.
During 2023, CROBEX10 managed to return an impressive 34%, based on the strong performance of many of its constituents. The stars of the show, however, are Podravka, HPB, Končar, and Span. These companies managed returns of 94%, 71%, 63%, and 41%, respectively, during 2023.
Price performance of CROBEX10, CROBEX10 constituents in 2023 (%)
Source: ZSE, InterCapital Research
As we can see, other companies did not slack off, however, with Atlantic Grupa, Adris (pref.), Valamar Riviera and HT are all offering double-digit returns. The only company to record a negative return was Ericsson NT.
How much did individual constituents outperform/underperform compared to the index (2023, p.p.)
Source: ZSE, InterCapital Research
Given the strong returns then, Podravka outperformed the index by almost 60 p.p., HPB by almost 37 p.p., Končar by 28.9 p.p., and Span by 6.6 p.p. The other companies, even with solid double-digit returns, underperformed the index by 9.5 p.p. for Atlantic Grupa, all the way to -46 p.p. for Ericsson NT. During 2023, there was a total of 250 working days in Croatia. Of all the CROBEX10 constituents, only Podravka outperformed the index in terms of better returns during these days. The remainder of the companies underperformed the index on this metric.
How often did CROBEX10 constituents outperform the index in 2023 (% of working days)
Source: ZSE, InterCapital Research
This brings us to an interesting conclusion and one that might not seem that obvious from the start. 2023 was an extremely good year for CROBEX10 and its constituents. As such, the high return recorded by the index was the weighted sum of the performance of the individual companies. In other words, if these companies gave returns on certain days, which by themselves might not seem much (especially when they’re weighted in the index), the overall index return was still high, since it takes into account all of their performances. When companies perform as well as most of these companies did then, they can significantly boost the index performance, leading to it “outperforming” them on those days.
As such, looking at this data by itself can be misleading. As such, it should be taken with other indicators, such as the price performance, or any other metric that one investor might be interested in. Still, 10 companies in an index do make things relatively simple. Imagine looking at an index such as the S&P 500, in which most of the companies have such low weights, that even if they gave a 100% return, a tiny increase in the index due to other companies’ performance (usually the largest ones) would still mean that the index would outperform that individual stock.
Here you can find the dates for the upcoming events of the regional companies
| wdt_ID | Date | Ticker | Announcement | Country |
|---|---|---|---|---|
| 5 | 25.1.2024 | KRKG | Krka Preliminary 2023 Results, Press Conference | Slovenia |
Due to the nature of these events, they are subject to change (might be postponed or canceled).