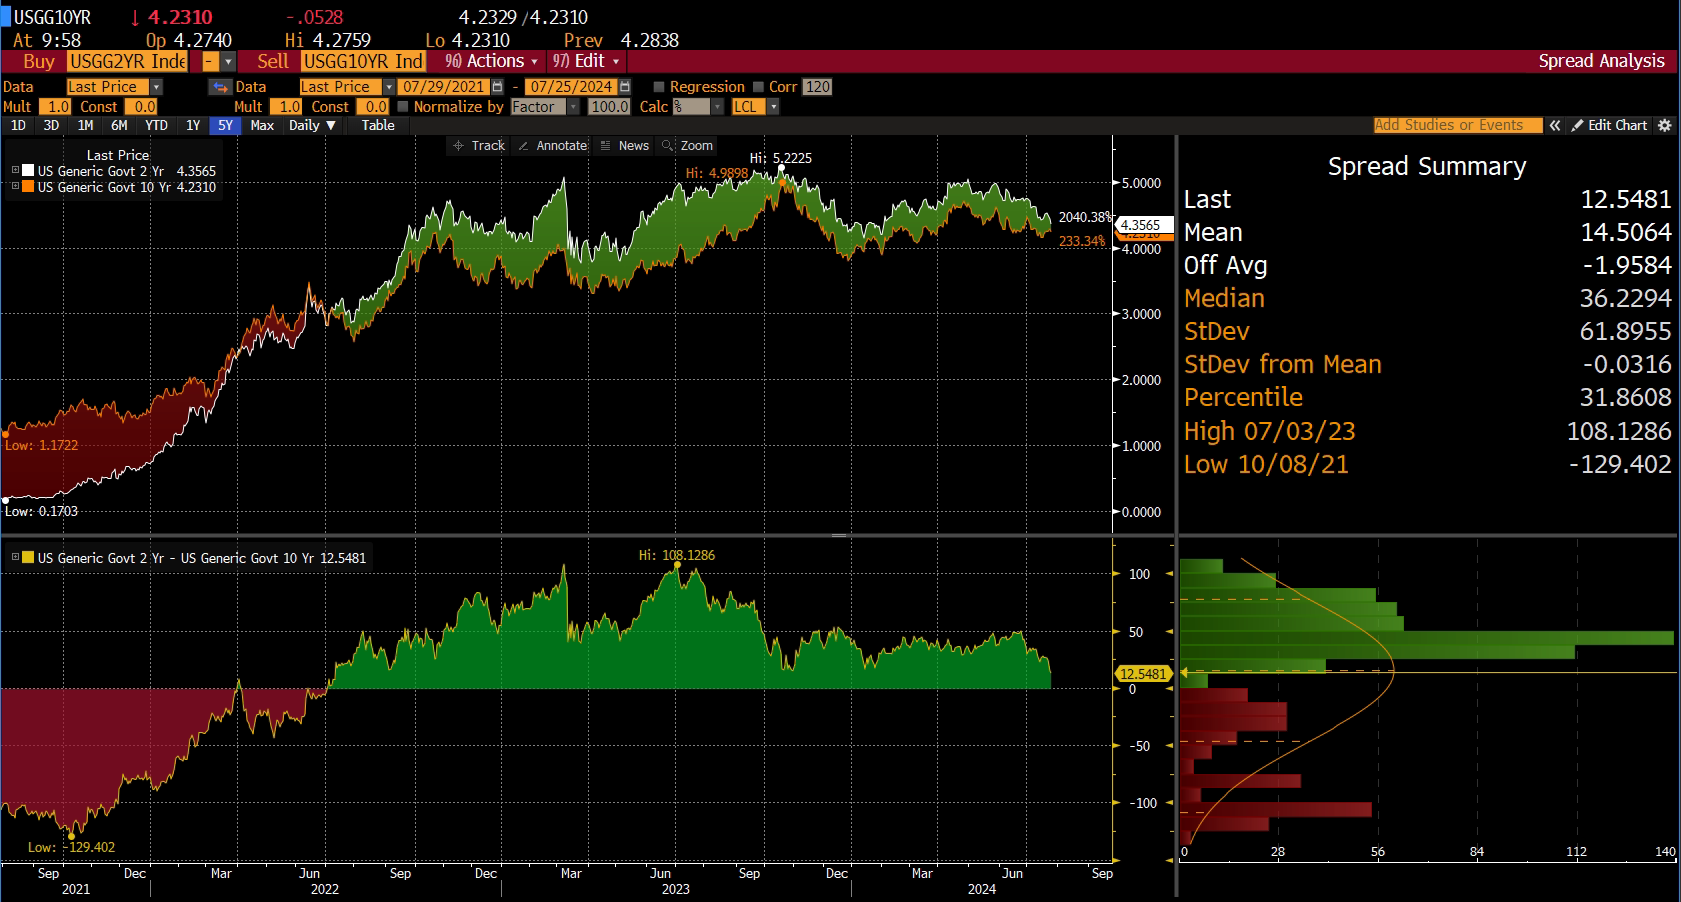
After more than two years of an inverted US yield curve (depicted by a positive US2Y10Y spread, i.e. 2Y YTM > 10Y YTM), the tide has started to shift. Every asset manager, every investment banker, and every finance professional you know hated the inverted yield curve since it stimulated cash hoarding and withdrawing money from long-term investment. Well, not anymore. How do you prepare for the regime when long-end yields finally exceed the shorter ones? Find out in this brief research piece.
How bad is the shape of the global economy? Well, hard data needs to corroborate this, but the financial markets are becoming pretty much convinced that the US is heading for a recession in the coming 12 months. But let’s take it step by step.
Yesterday’s HCOB PMIs came about rather ambiguous because at 9.15 CET HCOB French Composite PMI came somewhat above expectations (49.5 actual versus 48.8 consensus), despite HCOB French Manufacturing PMI dropping all the way down to 44.1. The market was nevertheless focused on services PMI (smashing 50.7 versus 49.7 consensus) and naturally French 10-year yields went slightly up on the news. We are puzzled by the move as well since it’s rather obvious that manufacturing PMI tells the story about the true state of the economy, while on the other hand services PMI is obviously influenced by the pending Olympic Games in Paris. But just 15 minutes later, at 9.30 CET, German PMIs poured cold water over financial markets since all three figures (Manufacturing, Services, and Composite) came 1pp-2pp below consensus. German PMIs clearly signal contraction territory, with HCOB Germany Composite PMI at 48.7 (versus 50.6 consensus). Employment went down across both sectors and this was mostly expected by the analyst consensus because of the notorious labour hoarding, however, markets themselves were unsure about the timing of that happening. Since employment is a lagging indicator, this is going to trickle down into lower personal consumption, the only question is when. Cyrus de la Rubia, chief economist at Hamburg Commercial Bank (HCOB) said that the report „looks like a serious problem“.
Across the Atlantic data also confirms the slowdown ahead – the Federal Reserve Bank of Philadelphia reported that credit card balances past 60 due days increased to 2.6% (versus 1.1% in 2021). Notice that with the three-month moving average of U-3 unemployment currently stands at 4.0% and it is 50bps above the July 2023 low (3.50%), meaning that the notorious Sahm rule points in the recession direction. But more importantly, the US yield curve finally began to steepen to a degree that is consistent with the pending slowdown. As the chart below points out, we are some 10bps odd away from the completely flat curve. We remind our readers that the mentioned curve steepening had two legs – the first, fiscal-driven steepening was induced in early July by rising odds of Donald Trump returning to the White House surfing on a „red wave“ of Republicans taking over the last two levers of power. The second leg of the curve steepening came about from short-term rates dropping sharply from the prospects of pending rate cuts.
On top of credit card balances, Sahm rule and curve steepening came also the William Dudley note that the FED should be inclined to cut rates as soon as next Wednesday (July 31st). We were surprised by this statement as well and it’s worth mentioning that Goldman Sachs, Mr. Dudley’s former employer, decided to back him up and now they also expect a rate cut in July. Is this realistic? Well, we thought that Biden dropping his presidential bid might appear to be unrealistic, and look where we ended up. Nevertheless, financial markets are not regarding this as a realistic prospect, which is depicted by BBG WIRP US function:
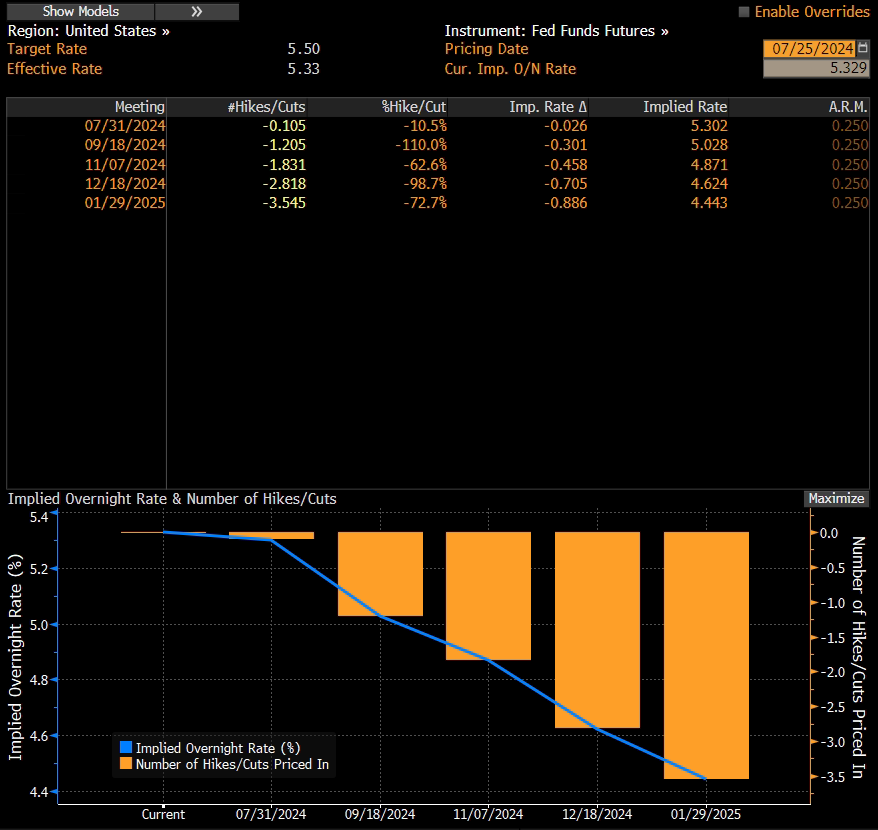
There is a catch, of course. Skipping the July cut might mean that more cuts might be in store for 2024 than previously expected. Also, we are closely monitoring any statement made by WSJ’s Nick Timiraos in case FOMC decides to float air balloons. This effectively means that summer becomes even more interesting for a handful of traders that decided to postpone their vacations.
In H1 2024, Končar D&ST recorded revenue growth of 47% YoY, an EBITDA increase of 237%, and a net income of EUR 56.8m, an increase of 2.5x YoY.
Yesterday, Končar D&ST, one of the main subsidiaries of Končar Group released its H1 2024 results. According to the report, Končar D&ST recorded revenue growth of 47% YoY, amounting to EUR 230m. Of this, export revenue amounted to EUR 221.2m, an increase of 57% YoY, and also representing 96.2% of the total sales revenue, an increase of 6.3 p.p. compared to the same period last year. This was to be expected, as Končar Group in general, but Končar D&ST especially has been focused on a lot on export activities with its products across Europe. This is also evident if we look at the Company’s backlog (contracts signed which are still to be fulfilled in the future), which amounted to EUR 800m on 30 June 2024, an increase of 42%, or EUR 237.6m in absolute terms compared to 30 June 2023.
Moving on, operating expenses amounted to EUR 162.3m, an increase of 17%, or EUR 23.6m YoY. Inside the OPEX, we can see that material expenses, the largest expense category has decreased by 4% YoY to EUR 134.8m, mainly due to lower costs of raw materials, which declined by 7% YoY to EUR 118.7m, which was also reflected in the general economy as lower prices of many materials have been recorded with the cooldown of inflation. COGS also declined significantly, by 91% YoY to EUR 0.4m, while on the other hand, other expenses grew by 75% YoY to EUR 15.7m.
As a result of the faster revenue than OPEX growth, EBITDA increased by 237% YoY to EUR 71.4m, implying an EBITDA margin of 31.1%, an increase of 17.5 p.p. YoY. In terms of the net financial result, it amounted to EUR 1m, increasing by over 2.6x YoY, as the financial income increased by 61% YoY due to higher FX gains & higher interest received, while financial expenses increased only slightly, by 7% YoY to EUR 1.1m.
Due to these developments, the net income amounted to EUR 56.8m, increasing by 2.5x YoY, and implying a net income margin of 24.7%, an increase of 14.3 p.p. YoY.
Končar D&ST key financials (H1 2024 vs. H1 2023, EURm)
Source: Končar D&ST, InterCapital Research
In terms of investments, while Končar D&ST does not provide us with exact numbers in the report, the Company did mention that it continues the large investment project “Sustainable SETup”). As part of this project, in the middle of June large construction works were started which are planned to be finished in Q3 2025.
Here you can find the dates for the upcoming events of the regional companies.
| wdt_ID | Date | Ticker | Announcement | Country |
|---|---|---|---|---|
| 17 | 26.7.2024 | WINE | Purcari ex-dividend date | Romania |
| 19 | 26.7.2024 | KOEI | Končar Q2 2024 Results | Croatia |
| 20 | 26.7.2024 | ADPL | AD Plastik Q2 2024 Results | Croatia |
| 21 | 26.7.2024 | EQNX | Equinox Q2 2024 Results | Slovenia |
| 22 | 29.7.2024 | HPB | HPB Q2 2024 Results | Croatia |
| 23 | 29.7.2024 | ARNT | Arena Hospitality Group Supervisory Board Meeting | Croatia |
| 24 | 30.7.2024 | ATPL | Atlantska Plovidba Audit Committee Meeting | Croatia |
| 25 | 30.7.2024 | ARNT | Arena Hospitality Group Q2 2024 Results | Croatia |
| 26 | 31.7.2024 | PETG | Petrol ex-dividend date | Slovenia |
| 27 | 31.7.2024 | SPAN | SPAN Q2 2024 Results | Croatia |
| 28 | 31.7.2024 | ATPL | Atlantska Plovidba General Assembly Meeting | Croatia |
| 29 | 31.7.2024 | ATPL | Atlantska Plovidba Q2 2024 Results | Croatia |
| 30 | 31.7.2024 | RIVP | Valamar Riviera Q2 2024 Results | Croatia |
| 31 | 31.7.2024 | SNP | OMV Petrom Q2 2024 Results | Romania |
| 32 | 31.7.2024 | TRP | TeraPlast Q2 2024 Results | Romania |
Due to the nature of these events, they are subject to change (might be postponed or canceled).