Last week Croatian Bureau of Statistics released October inflation data which showed that inflation continued increasing in October and stood at 13.2% YoY which is the strongest increase in at least 24 years. Inflation rates are increasing in the euro area as well while on the other side of the Atlantic it seems like the peak of inflation is behind us. In this article, we are looking at the main drivers of inflation in Europe and the differences between the US and Europe.
Inflation is the main macro theme in 2022 coupled with strong monetary policy tightening across the globe. As we were in a regime of very low or even negative inflation for the last few years, most of the investment strategies were to increase the risk profile and increase the duration of equity and bond portfolios to catch a few basis points more. And the strategies were successful until the consequences of the mega easing by both fiscal and monetary authorities due to the covid crisis. And for 12 months the market was listening to central bankers saying that inflation is transitory until Mr. Powell one year ago stated that we should retire that word and started a great U-turn from dovishness to significant hawkishness. Most central banks followed to curb inflation and to ensure markets that inflation will be put under control. This led us to one of the worst years on record for the asset classes with the only commodity complex being green YTD. Now we see that investors are waiting for one piece of information and one piece of information only each month, and that is inflation data. PPI, PMI, retail sales, or some other data are only viewed through the lenses of smaller or bigger inflation data for each month. October’s inflation disappointment in the US that was released on November 10th resulted in confirmation of a bullish trend for duration trades while EURUSD increased to almost 1.05. This showed how much cash is just waiting for inflation to subside to enter markets. However, it is all but clear where inflation is headed and whether will it decelerate to 2% or somewhere higher i.e., 4% or more. In any case, headline inflation stood at 7.7% YoY which was the lowest level since January 2022 while the main shock was core inflation that increased by ‘only’ 6.3%, undershooting expectations by 30bps. Deceleration was obvious in almost all sectors with healthcare services and prices of used cars being the biggest drivers.
Global bond, Equity & Commodity performance
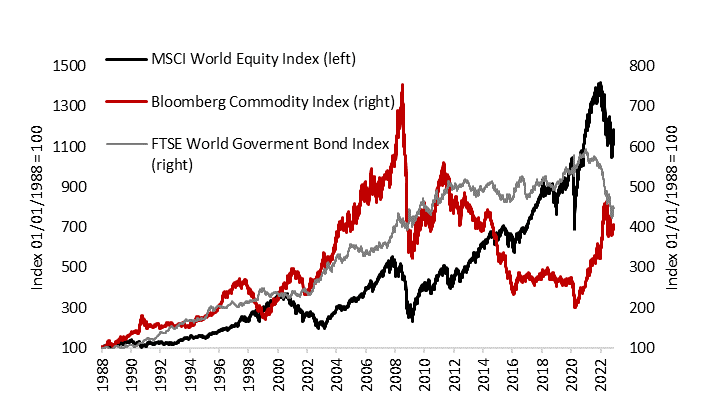
Source: Bloomberg, InterCapital
On the other side, inflation still did not see its peak in the euro area, as October’s inflation came at 10.6% which is the highest price increase on record. It is obvious that energy prices have driven the largest part of the inflation but higher energy prices resulted in large food inflation that stood at 15.5% in October. Services inflation lagged by rising only 4.3% YoY but still being at multi-year highs and with service inflation showing to be sticky in the past we do not expect it to decelerate dramatically soon. Talking about highs, October’s data showed that the highest inflation rate was seen in Estonia, Lithuania, and Hungary which all stood above 20% YoY, while the smallest was in France (7.1%) and Spain (7.3%). On Monday we witnessed a sharp fall in German PPI driven by energy prices, and this is most likely a signal for deceleration in goods inflation, but service inflation could still show some strength as stated above meaning that we could still see higher numbers in Europe.
Croatian inflation stood somewhere in the middle, rising by 13.2% which was the largest price increase according to the CBS data. The largest contribution to the growth rate of the annual index came from food (5.11%) and housing and utilities (2.72%). However, one should bear in mind that most of the utility prices were frozen by the government meaning that households did not feel any direct impact of the energy prices skyrocketing. The service sector prices increased dramatically, with restaurant and hotel prices rising by 17.8% YoY and we hear that many hotels plan to keep increasing prices for the next tourist season as well.
All in all, there are some signs that inflation pace could lower by a bit but we do not think that we are once again going to the below 2.0% inflation environment. We could see some months in the following period with negative MoM inflation but that will be a consequence of a recession in some parts of the global economy rather than structural deflation again. We expect inflation to keep being above the last decade’s average in both Europe and US due to de-globalization that was confirmed in 2022 with the war in Ukraine and Taiwan situation. Also, one should not forget about covid consequences that will most likely change the labor market forever, with workers being in a better position which could drive a faster increase in wages.
By the end of October 2022, the NAV of Croatian mutual funds decreased by 24.1% YoY, 23.4% YTD, and 0.1% MoM, amounting to HRK 16.47bn. Compared to its pre-COVID-19 maximum, it decreased by 28.6%.
Recently, the Croatian Agency for the Supervision of Financial institutions, i.e. HANFA, published the monthly report on the development of the Croatian financial markets, for the month of October 2022. According to the report, the NAV of Croatian mutual funds amounted to HRK 16.47bn, continuing the decline for the 2nd month in a row, albeit at a much slower rate. This would mean that it declined by only 0.1% MoM, but on a YoY and YTD basis, it declined by 24.1% and 23.4%, respectively.
With the importance of Croatian mutual funds in the Croatian financial market, seeing what changes they record can give us an indication of the overall market health. At the same time, it can show us how the current macroeconomic and geopolitical developments are affecting the funds, giving us even more valuable insights. In fact, here we can see that the NAV of the Croatian mutual funds is far from the levels it achieved in the pre-COVID-19 times, with it being 28.6% lower than those levels in October.
Looking at the changes recorded in the asset structure of these funds, on a monthly basis, the largest absolute decrease was recorded by deposit and cash holdings, which declined by 16.5% or HRK 558.5m. Following them, we have receivables, which declined by HRK 96.9m, or 61.6%. Finally, we have bond holdings, which decreased by 0.3% or HRK 28.3m. On the other hand, the money market recorded the largest increase, growing by 42.6% or HRK 266.4m. Next up, we have shares, which increased by 4.3%, or HRK 78m, and investment funds, which grew by 2.3%, or HRK 32.9m.
Meanwhile, on a YTD basis, the largest decrease was recorded by bond holdings, which decreased by 22.5%, or HRK 2.77bn, and deposits and cash, which decreased by 41.6%, or HRK 2bn. Shareholdings also recorded a noteworthy decrease, declining by 26% or HRK 672.9m. On the flip side, the only asset class to record an increase was the money market holdings, which increased by 84% or HRK 407m.
What this data can tell us are several things; Firstly, on a YTD basis, most of the asset classes recorded a decline, both due to the decline in value of the asset classes, to a certain extent, due to redemption of shares in funds that invest in these asset classes. Meanwhile, the MoM data can show us a certain slowdown of the trend; fewer investments are held in the safest types of holdings, i.e. deposits and cash, and more investments are made into money market holdings, shares, and investment funds, which do carry higher risk but also higher returns. This could be seen as a sign of stabilization, but due to the uncertainty we are currently facing, both macroeconomic and geopolitical, it’s too early to say for sure.
Total assets of all Croatian mutual funds (2015 – October 2022, EURm)
Source: HANFA, InterCapital Research
However, there is one other thing that influences the NAV of the funds besides the change in the value of the holdings, and that is the net contributions to the funds. If we looked at those, we could see that during the month, the net contributions were negative at HRK 134.9m, meaning that there were more redemptions from the funds than there were new contributions into the funds.
Turning our attention to securities and deposits, they amounted to HRK 14.87bn in October 2022, representing an increase of 2.97% (or HRK 429.3m) MoM, but a decrease of 19.9% YTD (or HRK 3.69bn), and 19.8% YoY (or HRK 3.67bn). Of this, domestic securities and deposits accounted for 53.75% of the total (or HRK 7.99bn), decreasing by 2.88% MoM, 27.6% YTD, and 26.8% YoY. Foreign securities and deposits accounted for the remaining 46.25% (or HRK 6.88bn), increasing by 10.7% MoM, but decreasing by 8.5% YTD, and 9.8% YoY.
In terms of the current asset structure of the Croatian mutual funds, bonds still hold the vast majority at 57.2%, representing an increase of 0.9 p.p. MoM, and 1 p.p. YTD, followed by deposits and cash at 17%, recording a decrease of 3 p.p. MoM, and 5.2 p.p. YTD. Next up, we have shares, which accounted for 11.4% of the total, which is an increase of 0.7 p.p. MoM but a decrease of 0.3 p.p. YTD, and investment funds, which accounted for 8.6% of the total, representing an increase of 0.3 p.p. MoM, and 1.2 p.p. YTD.
Croatian mutual funds AUM structure (October 2022, %)
Source: HANFA, InterCapital Research
Yesterday, InterCapital and Končar signed an Annex to the Market Making Contract, extending it until 31 December 2023.
This would mean that InterCapital vrijednosni papiri d.o.o. will continue to engage in market making for ordinary shares of Končar – Elektroindustrija d.d., listed on the Official Market of the Zagreb Stock Exchange.
The market-making service means that Intercapital will place simultaneous buy and sell orders for Končar shares, thus reducing the bid/ask spread and increasing the liquidity of Končar’s shares.
As a reminder, InterCapital vrijednosni papiri d.o.o. has continually acted as the market maker for Končar ever since 16 October 2014. The market-making mandate has been extended until 31 December 2023.
Here you can find the dates for the upcoming events of the regional companies.
| wdt_ID | Date | Ticker | Announcement | Country |
|---|---|---|---|---|
| 40 | 29.11.2022 | LKPG | Luka Koper Q3 2022 Results | Slovenia |
| 41 | 29.11.2022 | LKPG | Luka Koper summary of the business plan for 2023, 2023 business performance estimate | Slovenia |
| 42 | 30.11.2022 | UKIG | Unior Q3 2022 Results | Slovenia |
| 43 | 30.11.2022 | CICG | Cinkarna Celje Q3 2022 Results | Slovenia |
| 44 | 30.11.2022 | CICG | Cinkarna Celje performance plan for 2023 | Slovenia |
| 45 | 30.11.2022 | CICG | Cinkarna Celje financial calendar for 2023 | Slovenia |
Due to the nature of these events, they are subject to change (might be postponed or canceled).