As all regional telocs published their H1 results we decided to compare their current and historic fundamentals in order to see how they compare to one another.
Fixed telephony, where companies counted losses and declines for years, was partially replaced with some other services offered by telecos. The graphs show key performance indicators of HT and its peer groups which we usually observe: Telekom Slovenije, Magyar Telekom, Orange Polska and Telekom Austria.
Starting with the top line, one can observe that Telekom Austria stands out as the largest telco in terms of sales with the company regularly exceeding EUR 4bn.
Revenues of Regional Telcos (EURm)
When observing EBITDA, the majority of the observed telcos posted similar of operating profitability with margins between 33%-35%. As once can notice, the two outliers were HT whose margin exceeds 40% and Orange Poland who is an obvious laggard with an EBITDA margin of 28.8% in the TTM period.
EBITDA Margin of Regional Telcos (%)
From the side of profitability, Telekom Austria stood on the top of the list with ROE of 14.7%. Orange Poland was the biggest laggard as its net income plunged into negative territory in 2017 but struggled to achieve the level of profitability recorded by their peers.
ROE (%) of Regional Telcos
From a valuation perspective, most regional telcos are traded roughly around their median EV/EBITDA multiple of 4.25, with Orange Poland being an outlier. However, when we look at the P/E multiple one can notice some deviations. We should notice that HT’s P/E presented in the chart is not cash adjusted, however if we adjusted it, it would still be at an above median multiple of 25.3x.
Ports have attracted a lot of attention this year as global demand for goods has led to a surge in demand for containers. Meanwhile many ports remain blocked, unable to process the large amount of goods being delivered.
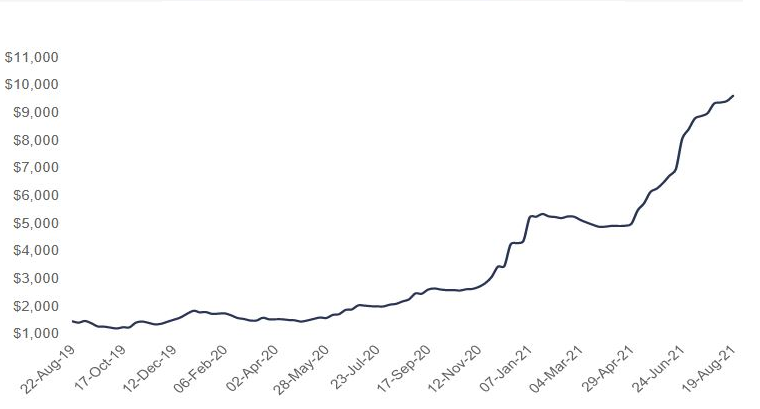
The Drewry Container Port Throughput Indices are a series of volume growth/decline indices based on monthly throughput data for a sample of over 235 ports worldwide, representing over 75% of global volumes. Last week the index increased marginally by 2% or $192 to reach $9,613.28 per 40ft container, 360% higher than the same week in 2020.
World Container Index (USD per 40ft container)
Freight rates from Shanghai to Los Angeles soared 6% or $647 to reach $10,969 per 40ft container, a change of 242% Y-o-Y. Spot rates on Shanghai to Genoa gained $268 to reach $13,261 for a 40ft box. Similarly, rates on Rotterdam to New York grew 1% or $45 to $6,435 per feu. However, rates on Los Angeles – Shanghai plunged 7%, a decrease of $103 to $1,358 per feu. Rates from New York to Rotterdam dropped 1% or $17 to reach $1,154 per 40ft box. Freight rates on Shanghai to Rotterdam, Shanghai to New York and Rotterdam to Shanghai remained stable at previous weeks level.
With demand remaining high, Drewry stated that they expect rates to increase further in the coming week.
The abovementioned comes as positive news for Luka Koper, whose results are expected to be released on Friday, Aug 27th.