For today we decided to present you with a updated analysis of how correlated have been CROBEX and S&P500 since the beginning of the year and during the partial bounce back observed in April & May.
If you have been following the Croatian and the US equity market since the beginning of the Covid-19 crisis, you might have seen certain similarities in the movement of CROBEX and S&P500. Therefore, last month we presented you with a brief analysis of how correlated the movements are the movements of CROBEX and S&P and have concluded a solid correlation between the indices during the crisis. Today, we decided to revisit the analysis given that April and May brought somewhat of a bounce back of the indices. S&P500 definitely witnessed a stronger recovery which led to it being down 9% YTD, while CROBEX is still 22% down YTD.
YTD Performnace of CROBEX and S&P500
If we were to take a closer look at daily movements of the indices, one can observe an interesting correlation, which is visible in the graph below. Since the Covid-19 outbreak, one can notice that almost every time when S&P500 recorded a sharp daily increase or decrease, the same movement of CROBEX was observed. This can be also confirmed when calculating the coefficient of correlation of YTD daily returns of both indices, which amounts to 0.71, showing a solid correlation between the movement of the indices. This has not been historically the case (to such extent) as the coefficient of correlation for the same parameters since 2015 amounts to 0.42, while since 2007 amounts to only 0.37.
Such a correlation could imply that since the outbreak of the Covid-19 crisis many investors in the Croatian equity market are not necessarily basing their investment decisions on fundamentals or the local news, but rather on the global sentiment. This would not surprise us as many fundamental parameters were and are still in a very unknown territory such as the end of the Covid-19 crisis, or the impact on the macro picture across economies.
However, if we were to look at the correlation between the indices solely in April, it amounted to 0.55, while in (so far) in May it amounted to 0.27. Such figures show that the indices were not as correlated during the partial bounce back as they were during the drop. It is also worth noting that as more fundamental parameters become clear in the local market, it is reasonable to expect a lower correlation than the current (on the YTD basis).
YTD Daily Change of CROBEX and S&P500 (%)
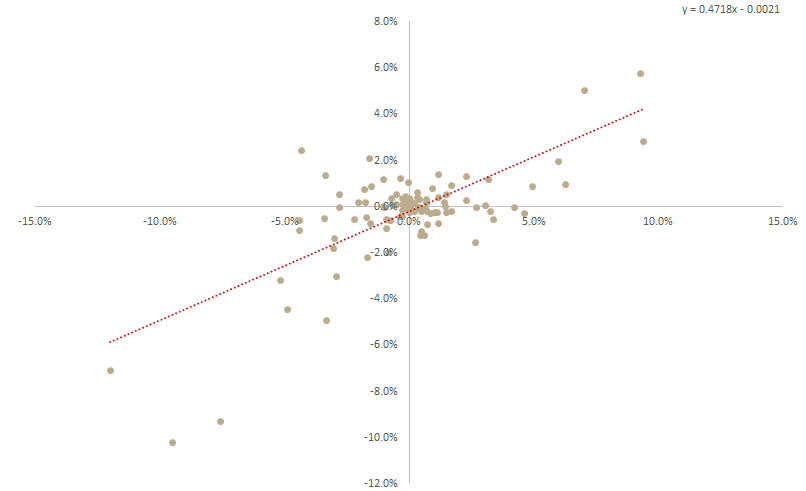
If we were to run a regression of YTD daily returns of CROBEX and S&P500, the slope of the regression gives us additional information of relative volatility of CROBEX. In the graph below, you can see that the slope of the regression amounts to 0.47 indicating that CROBEX has been roughly half as volatile as S&P500. So for example, an increase of 10% of the S&P500 would indicate a 4.7% increase of CROBEX.
Regression of YTD Daily Changes of CROBEX Against S&P500
In Q1, the company recorded a 3% decrease in sales, a 3% decrease in EBITDA and a 36% decrease in net profit.
In Q1, Intereuropa recorded a 3% decrease in sales of EUR 38.4m, which is 7% below the planned level. The failure to achieve the planned target could mainly be attributed to the Covid-19 pandemic.
The company notes that reduced volume of imports from China was seen in the intercontinental transport segment as early as January, while all other business lines recorded a sharp fall in sales during the second half of March. The crisis is also expected to affect the operations of Group companies during the Q2. The exception is the air freight segment, which exceeded last year’s and planned results due to the organization of the charter transport of both goods and passengers.
When observing sales by business line, land transport which accounts for 52% of total sales recorded a 3% decrease. The lower sales results of the land transport segment relative to last year were primarily the result of a drop in revenues at key customers due to the consequences of the Covid-19 epidemic. Intercontinental transport which accounts for 27% of total sales recorded a 7% decrease. Meanwhile, Logistics solutions (17% of total sales) recorded a 2% increase, however a 3% decrease compared to the plan.
Market wise, Slovenia (67% of total sales) recorded an 8% drop, while Croatian market (15% of total sales) recorded a slight increase of 1%.
In Q1, operating expenses observed a decrease of 2.4% YoY, amounting to EUR 37.7m. Such a decrease could be mainly attributed to cost of goods, materials and services (-4%). As a result of the above, EBITDA amounted to EUR 3m, representing a decrease of 3%. However, such a figure is 10% higher compared to the plan. The main reasons for higher-than-planned EBITDA were the positive impact of lower labour costs due to a lower number of employees and the receipt of government assistance under the ZIUZEO. Such a result puts the EBITDA margin at 7.2% (flat YoY).
Going further down the P&L, Intereuropa recorded a net financial result of -0.46m compared to EUR – 0.36m. The was worse than planned mostly due to higher net FX loss due to the depreciation of the Ukrainian currency.
In Q1, The Group’s net profit amounted to EUR 0.5m, which was 26% lower than planned and a decrease of 36% YoY.
Plan for 2020
- Sales: EUR 170.7m, through growth in all business lines of the core activity
- EBITDA: EUR 13.0m
- EBIT: EUR 6.4m
- Investments: EUR 6.9m in property, plant and equipment and intangible assets, primarily in the upgrading and renovation of the warehousing infrastructure and warehouse equipment, in the upgrading of IT equipment and in intangible assets