In 2020 we saw a sudden drop of global economic activity and trade as the COVID-19 pandemic broke out, which had a significant impact on ports worldwide. Now as global trade is on a track of recovery, we turn our attention to ports, the gates of global trade.
Just as it did in almost all other industries, the pandemic has created a unique situation in the market as more people are stuck at home buying things, and money has been reallocated away from services to goods. As a result, businesses across the board have faced inventory shortages since the pandemic hit, with most unable to keep pace with the increased demand.
This can be noticed when observing the Drewry World Container Index. Namely, the Drewry Container Port Throughput Indices are a series of volume growth/decline indices based on monthly throughput data for a sample of over 235 ports worldwide, representing over 75% of global volumes. As one can notice from the chart, the index surged in Q4 2020, reaching an all-time high in November. In recent developments, the index fell 1.7% last week, however it still remains 233.2% higher than a year ago.
World Container Index (USD per 40ft container)
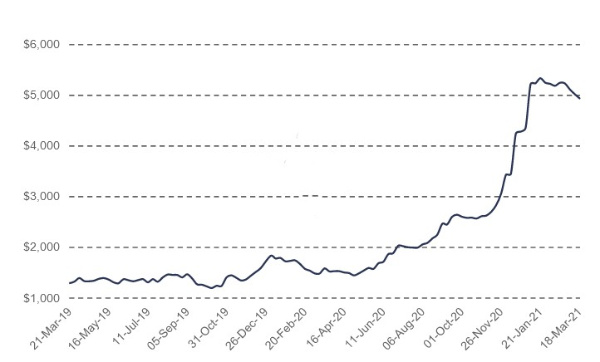
Source: Drewry, InterCapital Research
Adding to that the decreasing number of blanked sailings in 2021, thus far, one could conclude that the outlook for the container shipping markets remains strong moving into 2021. Yet this isn’t without any threats. Namely, the resurgence of COVID-19 has set back the recovery across Western Europe, with national economic performances showing considerable variation due in large part to differences in the timing and breadth of activity restrictions.
| Blank & skipped sailings (as % of total sailing count) |
On the other hand, while container outlook remains positive, another important source of revenue for ports is the transport of cars which doesn’t have such a clear outlook. Namely, with Europe’s demand for new vehicles still lagging, many ports will continue to feel the pressure of missing revenue.
Regional Impact
Turning our attention to how this translates to ports in our region, we ill observe some key results of Luka Koper, the largest port in our region.
As one can notice from the chart, Luka Koper’s FY 2020 performance was in line with market tends. Namely, the throughput of containers remained stable, decreasing only by 1% YoY (in TEU). Meanwhile the number of cars transported fell -10% YoY.
Throughput of containers (number containers and TEU) and cars (in units) in 2020 and 2019
When looking at Luka Koper’s valuation multiples, one can notice that Luka Koper is trading significantly below their peer group with a 67% discount on current P/E and 52% on EV/EBITDA multiple. However, we should highlight that business models are not fully comparable (as Luka Koper is both port operator and port authority), and also due to the fairly small number of peer companies, we decided to throw in two well-established listed ports from the northern German coast, namely Hamburger Hafen und Logistik and EUROKAI.
Selected Ports P/E
Selected Ports EV/EBITDA
At the current share price, the dividend yield is 6.1%. The ex-dividend date is 4th August 2021.
Petrol published an announcement on the Ljubljana Stock Exchange proposing the distribution of net profit from 2020. The company proposed to distribute EUR 45.22m to shareholders which translates into EUR 22 dividend per share, the same as the previous year.
The proposal was set by taking into account necessary investments, free cash flow, the Company’s debt levels, development plans, retained earnings from previous years, appropriate net financial debt to EBITDA ratio and the liquidity situation.
At the current share price, the dividend yield is 6.1%. Note that the ex-dividend date is 4th August 2021. Dividend is subject to approval at the GSM, which will be held on 22nd April 2021.
As a reminder, the dividend policy target for the strategic period 2021 – 2025 is 50% of the Group’s net profit, taking into account the investment cycle, Group indicators and the achieved objectives.
In the graph below we are bringing you an overview of the Company’s historical dividends per share and dividend yields.
Dividend per Share (EUR) & Dividend Yield (%) (2013 – 2021)