A spectre is hunting the world – a spectre of reflation. This increased long term nominal yields, but it has also opened up some interesting opportunities on long term bond futures and their derivatives. Also, it has changed our valuation of new Croatian eurobond. What can we expect down the road and how do you hedge against further losses, find out in this brief research piece.
Global fixed income instruments have been fighting for air lately as reflation becomes the word of the day. First of all – what happened? Long term yields have been steadily rising since late summer last year, but the rise in nominal yields gained momentum about ten days ago when US Treasury Department Chief Janet Yellen said on G7 ministerial conference that US might return to full employment as soon as next year. A bold statement came on top of her sentence that it’s time to go big on fiscal spending in order to reduce the output gap, which was actually a signal to US congressmen to hurry up Biden’s 1.9 trillion USD spending plan. The size is actually estimated to be 2-3 times the output gap and it’s reasonable to ask is it possible that this might push the nominal GDP above the potential GDP threshold, a move that would stoke inflation. Macroeconomic minds differ on this one, with IMF chief economist Gita Gopinath claiming that the odds of that happening are quite low due to decades of globalization, capacity buildup and automatization. Needless to say that US was close to full employment back in 2019 and inflation was nowhere to be seen. However, the markets think this time it’s different.
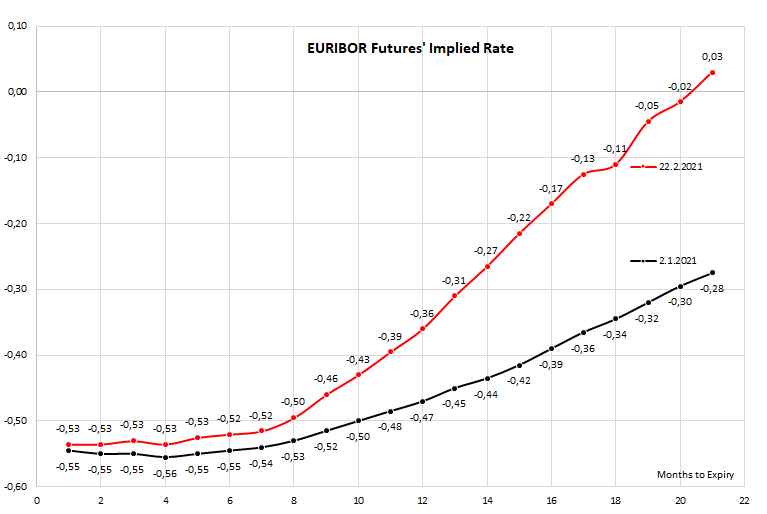
By looking at the chart above (EURIBOR futures curve), it’s easy to spot the nexus between higher inflation expectations and higher yields. The markets are betting on inflation getting out of hand and central banks feeling compelled to lift interest rates in a manner of Paul Volcker back in the 1970s. This is way longer part of the EURIBOR futures curve went up and naturally, long term yields have kept up with the Joneses. It’s worth remembering that both the FED and ECB have been preparing the institutional framework to free their hands if they become victims of temporary inflation shocks. In August 2020 FED Chairman Jerome Powell called the new framework „flexible form of average inflation targeting“ (FAIT) – in a nutshell, it means that the FOMC is no longer worried just about inflation overshooting the target, but also about inflation staying below 2.0% for an extended period of time. The FED might turn a deaf ear to brief inflation overshoots since they only make up for a decade of low inflation and low growth. This means that when Jerome Powell says that the financial conditions would remain accommodative and supportive for extended period of time and that the FOMC is still not considering lifting rates or rolling back asset purchase, he really means it.
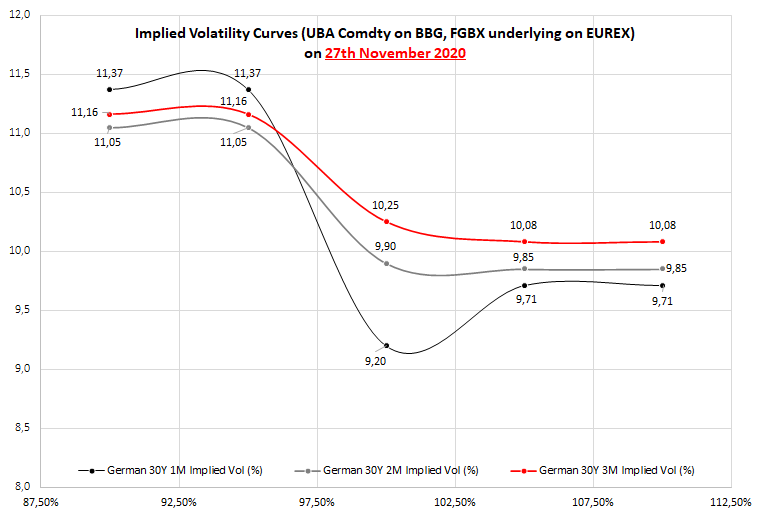
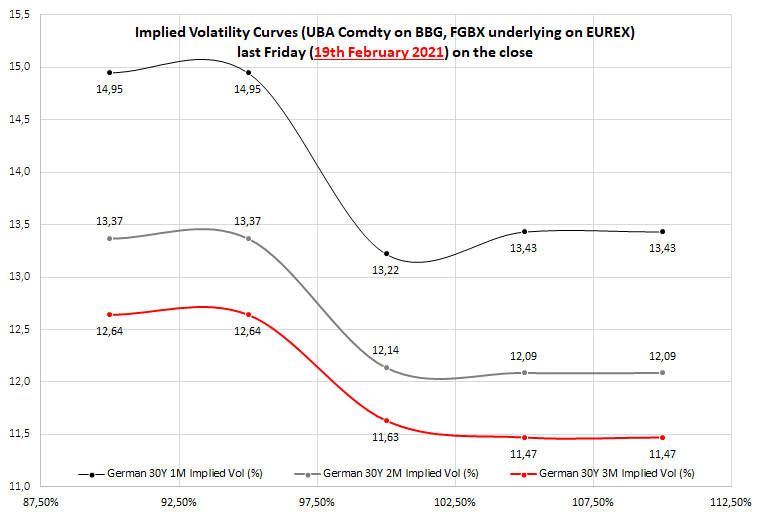
But it’s completely another thing weather financial markets trust him or not. So what do you do in times like these if you have long bonds on your portfolio? From our understanding, the bid-ask spread on long (30Y+) periphery bonds has widened considerably and selling Portugal, Spain or Italy might incurr additional cost. One way to tackle recent bond sell off is simply to hedge your position with BUXL options (UBA Comdty on BBG, FGBX on EUREX). Here’s a curious thig we have seen this morning: the difference between 1 month and 3 month ATM BUXL put implied volatility is at 1.59 (13.22 – 11.63 = 1.59), which is the highest value at least since January 2020 (average 1M-3M put implied volatility was -0.14, so 1.59 represents 3.8 standard deviations from the mean). The curve is obviously in backwardation and that might be an opportunity to create lucrative calendar spreads. To translate that into prices: UBH1 03/26/21 P206.00 can be sold at 3.08 and UBH1 05/21/21 P206.00 can be bought for 4.70, netting a total cost of 1.62 for the overall strategy. This is just for indication purpose and please bear in mind that calendar spread would not protect from further UBA Comdty downside if your strategy is delta positive. What we wanted to underline here is that BUXL backwardation between front months and 3rd month is the highest in a year, meaning that you can cheapen your hedge by selling some short dated BUXL puts.
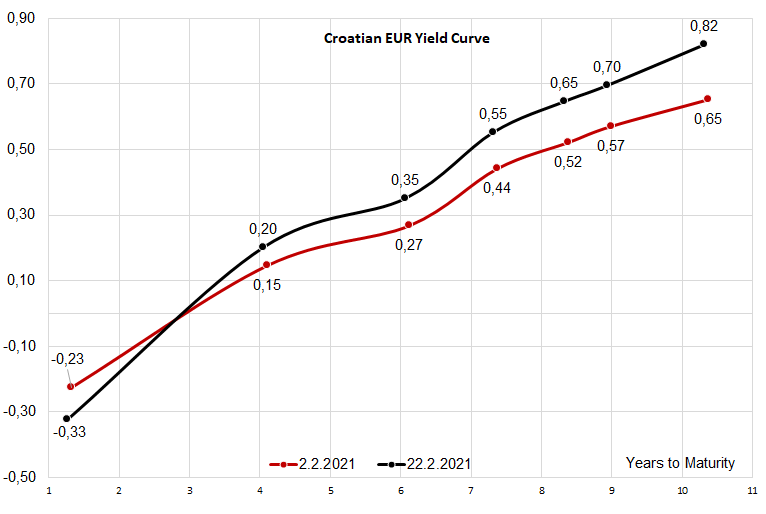
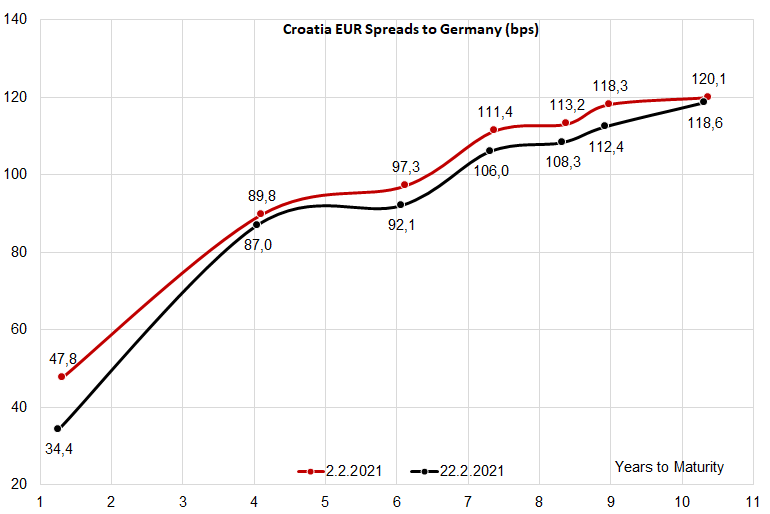
What about Croatian eurobonds? The sell off has been abrupt and intense so some scars are clearly visible. So far we haven’t seen much sellers, possibly because a lot of domestic institutional sellers might be underinvested in the anticipation of new Croatian eurobond. However, by looking at the long end (CROATI 1.5 06/17/2031) we can easily spot the 17bps rise in yield between beginning February and now. Rising yield curve means that the new paper might come at a lower reoffer price, but that doesn’t mean much for UCITS funds loaded with long term CROATIs and ROMANIs – they are in red already and might be inclined to sell if faced with liquidity outflows. The spread hasn’t widened at all – in fact, it even tightened on the longer end, but should the sell off gain foothold, it’s quite likely the spreads would widen.
Related to the new Croatian eurobond which is expected to print in the near future, all of the time we have used REPHUN 1.75 06/05/2035 as a canary in a coal mine for pricing of new CROATI and currently the live bid on this one corresponds to a 1.11% YTM. For the CROATI 14Y duration this might be the yield that investors would receive if they decide to enter the new paper.
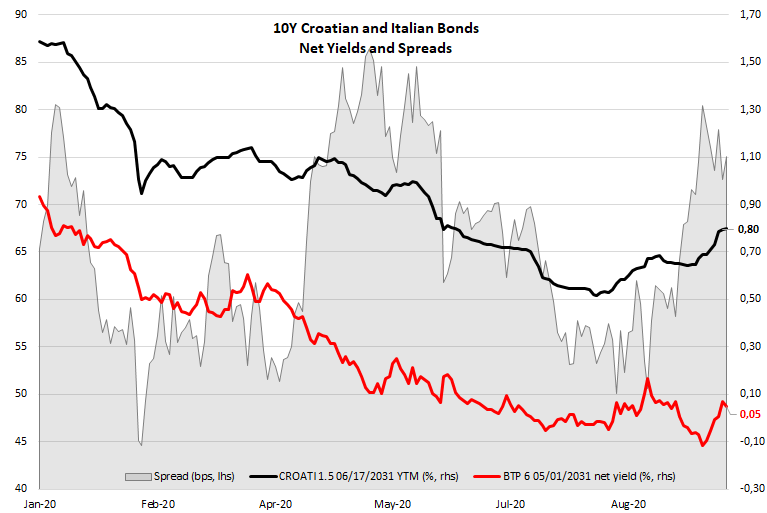
Finally, here’s something worth thinking about once you take your eyes off the screen and consider long term trends. Croatian Eurobonds are still relatively cheap compared to Italian bonds (BTPs). We have compared CROATI 1.5 06/17/2031 YTM versus a net yield to maturity on BTP 6 05/01/2031 and found out Croatia still gives some 75bps of extra annualized return compared to Italy. But first, what is a net yield? In Italy there is an interest rate tax in size of 12.5% that reduces your coupon income and with it realized yield to maturity. Subtracting the effect of interest rate tax we get to Italian net yield – this is what your portfolio actually receives once you pay all the taxes. If you have Bloomberg at hand, you can see that BTPS 6 05/01/2031 is currently traded at 152.65–152.75 clean price (0.648%-0.641%) and the YTM’s in parenthesis are used to calculate the notorious lo spread that is carefully monitored by Italian business newspaper. The calculation of lo spread is simply wrong and you should look at the net yield instead, which is far from 0.65% on the screen. If you run YAS function on Bloomberg and plug in 152.65 as clean price, you can easily see that net yield is somewhere around 0.055% (red letters on the chart below). We have calculated historic values of this net yield and calculated the corresponding spread to net yield, which is the grey area on the last chart. The spread was as tight as 45bps before the pandemic and with all good things in store for Croatia, we think it might tighten even blow 45bps as the good times roll (euro area membership, EU recovery fund, relatively low public debt compared against EA periphery peers etc.).
Luka Koper published their FY 2020 results last week, showing an -8% YoY decrease in sales. Meanwhile, EBITDA fell -15%, while net profit amounted to EUR 32m (-21% YoY).
In FY 2020, Luka Koper’s sales decreased by -8% YoY, amounting to EUR 209.9m. Net revenue from sale from market activities amounted to EUR 203.6m (-8% YoY), whilst revenue from the performance of the public utility service fell by 24% YoY, amounting to EUR 6.3m. The reason behind the drop in sales was, of course, the outbreak of the COVID-19 pandemic.
The total amount of throughout in tons decreased by -14% YoY, amounting to 19.5m. Other than the outbreak of the pandemic, the drop in the throughput of dry bulk and bulk cargoes was additionally affected by the EU legislation, which forecasts complete decarbonisation in the coming years and the introduction environmental taxes on CO2 emission, due to which some consumers started to abandon the use of the coal for the production of energy yet in 2020.
Maritime throughput in tons per cargo groups in 2020 and 2019
However, the throughput of two strategic product groups, containers and cars remained stable, mainly the throughput of containers, which in 2020 decreased by only 1% YoY (in TEU).
Throughput of containers (number containers and TEU) and cars (in units) in 2020 and 2019
EBITDA fell by 15%, amounting to EUR 61.8m. The decrease was mainly due to lower sales, as operating expenses were down -1% YoY. Namely, cost of material, services and other operating expenses decreased, whilst labour costs increased. The increase of labour costs resulted from a higher number of employees and payments of crisis supplement to the employees in compliance with the provisions of the Act determining the intervention measures to contain the COVID-19 epidemic and mitigate its consequences for citizens and economy.
As a result of the abovementioned, net profit amounted to EUR 32m, representing a -21% YoY decline.
CAPEX almost doubled, amounting to EUR 68.1m (+74% YoY), with the aim of increasing the port’s facilities. Namely, a new RO-RO berth was constructed and put into use, additional railway tracks were laid–both in the rear areas of the Basin III for the needs of the Car terminal. The construction of parking garage continued, works at the new, third Bertoki truck entrance are to be finalized, the transhipment equipment and a new fire-fighting vehicle. However, the most important investment in 2020 was the start of construction of the extension of the container quayside, which jointly with other planned additional areas in the front of the Pier I is a key investment in order to maintain the competitive position in containers. Note that despite everything, CAPEX in 2020 lagged 22% behind planned.
Luka Koper Key Financials (EUR)
In 2020, the company recorded a decrease in operating income of 35%, decrease in CCS EBITDA excluding special items of 38% and a net loss of HRK 1.14bn.
2020 was definitely a very challenging year for INA, as the company reported a net loss for the first time since 2015.
The product demand in certain periods of 2020 dropped by 30-50% YoY, heavily impacting performance on captive market. Regardless of the partial oil market recovery in the second half of 2020, oil and gas prices were more than 30% YoY lower on average in 2020. This had significant impact on the Upstream result, but the severe mobility restrictions and significant decline in economic activity, caused by the COVID-19 restrictions, also impacted the Refining and Retail operations.
As a result, the company reported an operating income of HRK 15.26bn, representing a decrease of 35%. Retail sales volumes deteriorated due to the weaker tourist season and mobility restrictions, with volumes decreased by 16% YoY. Besides that, lower prices impacted sales revenues negatively by HRK 1.04bn. To be specific, 34% lower realised Brent price resulted in HRK 611m lower crude oil and condensate sales revenues, while lower gas prices resulted in additional HRK 396m decrease.
Operational result moved in line with the deteriorated environment and CCS EBITDA excl. special items of INA Group dropped significantly to HRK 1.783bn, a 38% YoY decline.
Operation of Exploration and Production, traditionally the main driver of result, was marked by a combination of the mentioned drop in realized prices and continued trend of lower production. This drove the segment’s EBITDA to HRK 1.013bn, a drop of 57% YoY. CCS EBITDA excluding special items of Refining and Marketing including Consumer Services and Retail stayed strong at HRK 639m in 2020 mainly due to Retail contribution and cost saving measures.
In 2020, Ina recorded a net loss of HRK -1.14bn (compared to a profit of HRK 489m in 2019), as it was also significantly impacted by one-off non-cash items, such as impairment charges related to refinery assets in Sisak and Crosco Group assets, related to drop in engagement. On the positive side, the company managed to remain cash flow positive, with a NCFO amounting to HRK 2.2bn.
On Friday NLB’s share price noted a sharp increase of 6.31%, closing at EUR 47.2 per share.
Following the company’s preliminary announcement of FY 2020 results, NLB’s share price surged, indicating a very positive reaction from the market. The stock ended the trading day at EUR 47.2 per share, representing a daily increase of 6.31%. At the current share price, the company is traded at a P/B of 0.5x (9M 2020 results).
As a reminder, the Group reported total net operating income amounted to EUR 504.5m, representing a 2% decrease YoY. Profit before impairments and provisions amounted to EUR 210.5m, a mere 1% decrease YoY, supported by non-recurring income (the sale of NLB Vita and debt securities). Profit after tax amounted to EUR 268.9m (+38.95 YoY), strongly affected by the acquisition of Komercijalna banka, which had a net positive impact of negative goodwill in the amount of EUR 137.0m, and additionally established EUR 13.4m for expected credit losses on the performing portfolio for the Komercijalna banka group.
Excluding the impact of the acquisition, Group profit would amount to EUR 141.3m, representing a decrease of 27% YoY. Such a result significantly exceeded previous forecasts by the Group, mostly because of better-than-expected COR performance. We note that such a result is above our expectations as well, due to the same reason mentioned.
Besides that, the company indicated a dividend payment stating that their CAR is at 16.6%, with EUR 92.2m from 2020 profits already anticipated for dividend distribution, while excess capital above the regulatory requirement provides a robust basis for continued growth. Such a dividend payment indicates a high dividend yield of 10.4%.