Local banks are an integral part of Croatian fixed income market and have lately been an important source of demand for Croatian bonds. They are usually net buyers of short dated bonds and speculators on longer part of the EUR and HRK curve. To learn more about their behaviour in recent year, go through this short article.
According to the most recent data published by the central bank, by the end of November 2018 Croatian banks held a total of 57.5b HRK (7.76b EUR) of debt securities on their balance sheet, which equals 14.0% of the total assets held. Out of these 57.5b HRK, the treasury bills issued by the Ministry of Finance make up some 8.5b HRK (14.8%), while 24.1b HRK (41.9%) is made up of Croatian bonds – both domestic and international alike.
Here’s where things get interesting – by the end November, Croatian banks held a total of 5.8b HRK worth Croatian international bonds, a considerable increase compared to end-2017 when they held 5.1b HRK; a 13.7% increase could not be attributed to capital appreciation alone. What is the most liked one? Well, in December 2017 the banks held a total of 449m HRK of CROATIA 2019 USD, and the amount held has been steadily increasing. By mid-2018 the amount had increased to 703m HRK and finally by November 2018 the amount held reached 832.5m HRK. Naturally, there has been an appreciation of the dollar versus the euro in period December 2017 – November 2018, but even this appreciation could not explain the 85% position increase – instead, we should assume the banks were better buyers of the shortest Croatian USD eurobond, possibly for ALM purpose. In the same time frame the Croatian banks increased their positioning in CROATIA 2020 USD by 273.2m HRK (to 628.0m HRK last November) and in CROATIA 2024 USD by 219.1m HRK (to 349.7m HRK). However, the banks have been shunning CROATIA 2021 USD – the positioning in this paper decreased from 265.4m HRK (end-2017) to merely 37.6m HRK in November 2018.
But in our search for the eurobond darling of the banks, we should switch our focus on the euro curve: as a matter of fact, the largest positioning in Croatian Eurobonds was reported on CROATIA 2030 EUR; in November 2018 the banks held a total of 1.14b HRK of this paper, most of it probably bought on the primary market exactly one year earlier. Here’s the deal: the banks held a total of 1.3b HRK back in December 2017, meaning that there has been some profit taking in the first trimester of 2018 (the price of the paper tanked below 97.943 reoffer only in June, but regained strength as soon as the following month). Apart from the CROATIA 2030 EUR, Croatian banks have been buying CROATIA 2022 EUR (the positioning increased from 748m HRK in December 2017 to 989m HRK in November 2018), as well as CROATIA 2025 EUR (positions increased from 460.9m HRK to 1.0b HRK).
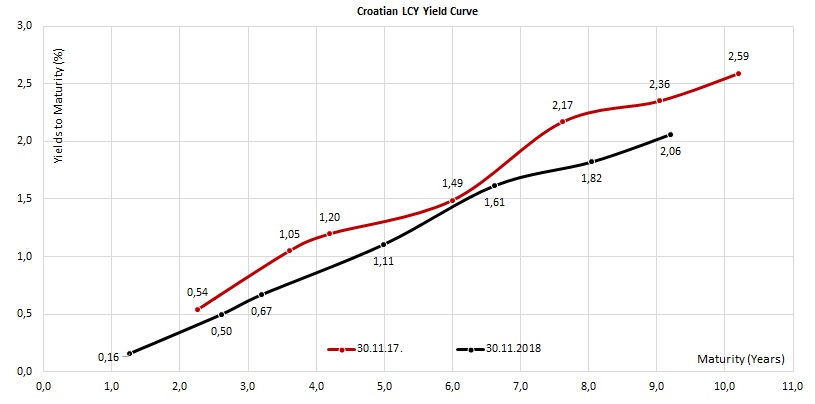
Finally, the HRK curve: first of all, it’s worth mentioning that LCY bond holdings of the banks went up from 12.7b HRK (December 2017) to 15.3b HRK (November 2018), a +20.5%increase in just less than a year. The move was obviously facilitated by the continuously rising excess liquidity in the financial system. Here’s what the banks were buying: out of the 15.3b HRK in total, 5.3b HRK (33.9%) is composed of H23BA and 3.8b HRK (24.2%) is made up of H217A; together, these two bonds make up some 58.1% of total bank HRK bond holdings and about 15.8% of banks’ total FI holdings irrespective of the currency denomination. Nevertheless, these bonds are probably held for ALM purpose, not for trading, since the positioning in these two exhibits very little volatility which could be explained by price appreciation alone. On the other hand, the banks have been buying H26CA and H282A, while the positioning in H297A remained steady in the months after the primary market had ended. This is one of the reasons why the LCY curve went considerably south, as the chart submitted below would suggest.
In 2018, life insurance increased 7.4% YoY, non-life insurance increased by 5.4%, while total GWP increased 5.8%. Net income increased by 29.3%.
As Croatia Osiguranje published their 2018 preliminary results, we are bringing you some key takes from the report. According to it, the company observed a 5.8% YoY increase in total GWP, amounting to HRK 3.3bn. Of that,
Croatia Osiguranje GWPs (2015 – 2018) (HRK m)
Furthermore, written premiums amounted to HRK 2.9bn, which represents a 7.9% increase and 79.8% of the total revenue.
When observing the company’s expenses, Claims amounted to 1.6bn which is an increase of 6.6%, amounting for roughly half of the total expenses. Note that non-life insurance observed an increase in claims of 2.5%, while life insurance observed an increase in claims of 19.4%.
Moreover, Acquisition cost accounted for 36.7% of the total expenses amounting to HRK 1.2bn (+5%).
In 2018, Croatia Osiguranje recorded a net income of HRK 327.2m, which represents a 29.3% increase.
Croatia Osiguranje Net Income (2015 – 2018) (HRK m)
Note that in January 2019, according to the GWP Development Report in Croatia, Croatia Osiguranje (together with Croatia Osiguranje Kredita) continues to account for roughly one third of the market share.
The investment plan (CAPEX) for 2019 amounts to RON 739m.
Electrica Group published a document in which they note that their Board of Directors approved the consolidated value of the investment plan (CAPEX) for 2019 in the amount of RON 739m. Out of this value, RON 710m represents the investment plan of the distribution subsidiaries.
Note that on 12 February, ANRE published an investment plan that must be commissioned by Electrica Group’s distribution operators during 2019, amounting to RON 608m.
Also note that in 2018, the Group assumed an investment plan in the distribution infrastructure, worth RON 900m, while the investments in 2017 amounted to RON 727m.