In H1 2023, Ericsson NT recorded a revenue decrease of 2% YoY, an EBITDA growth of 44.3%, and a net profit of EUR 12.2m, a 34.3% YoY increase.
In total, the Company’s sales revenue amounted to EUR 138m, representing a decrease of 2.2% YoY. The Company noted that this development is positive in light of the current macroeconomic situation, as it shows the stable operations of the Company. They also noted that the delivery of services to Ericsson has continuously grown, and has offset lower sales revenue in the domestic and export market which was caused by reduced operators’ capital investment.
Breaking the sales down further, the domestic market accounted for 37.6% of the total revenue, or EUR 51.8m. In this segment, Ericsson NT notes that from 2024, the technology unit for the construction and maintenance of HT’s network will transfer from Ericsson Nikola Tesla Servisi d.o.o. to HT, which is a result of their development strategy. Until the end of 2023, the company will work on the realization of obligations under the existing contract for the construction and maintenance of HT’s network, while partnership with HT continues in other segments. Also, the company signed several contracts with existing and new customers thus securing a continuation of good business performance and a significant level of orders booked. In the Digital Society segment, they also pointed out the contract with the Ministry of Tourism and Sport, the Ministry of Justice and Public Administration, the State Geodetic Administration, the Croatian Pension Insurance Institute, the Ministry of Labor and a few others. Further, the Company noted that intense sales activities on new business opportunities are ongoing.
Next up, looking at the most prominent segment, i.e. services to Ericsson, which accounted for 52.4% of the total revenue (or EUR 72.2m). In this segment, the company noted one of the most important projects in Ericsson Nikola Tesla’s R&D Center is the development of a new RAN Computer product family generation, where the main objective is to increase capacity compared to the current generation. This big and complex project will deliver a new product that will ensure Ericsson’s even stronger position as 5G technology leader.
The last revenue segment, export markets, which accounts for 10% of the total revenue (or EUR 13.9m). Ericsson emphasized that they continued strong cooperation with the operators HT Mostar, Crnogorski Telekom, Telekom Kosova and IPKO on the expansion and modernization of mobile networks. National regulatory authorities for postal and electronic communications have awarded 5G licenses to IPKO and Telekom Kosovo, and investments are expected in the upcoming period.
Ericsson NT sales revenue breakdown (Q1 2017 – Q1 2023, EURm*)
*Converted using CNB’s EUR/HRK average exchange rate for the quarters in question
Gross profit amounted to EUR 18.4m, an increase of 34.3% YoY as a result of the business mix and operational and cost efficiency, but also due to the fact that the previous year was affected by one-off costs item of contract termination, as a result of geopolitical sanctions. This would also imply a gross profit margin of 13.3%, an increase of 3.6 p.p. YoY. Moving on to EBITDA, it amounted to EUR 17.8m, also representing a solid increase of 30.8%. This would also mean that the EBITDA margin amounted to 12.9%, an increase of 3.2 p.p. YoY. In terms of OPEX, it amounted to EUR 126m, which is a decrease of 5.5% YoY. This was achieved due to the fact that Material costs managed to stay flat and amounted to EUR 60.9m, while staff costs increased by 7% YoY combined with negative changes in inventories (-UR 10.7m).
Meanwhile, the op. profit amounted to EUR 14.7m, an increase of 44.3% YoY, implying an EBIT margin of 10.7%, an increase of 3.4 p.p. YoY. The net financial result was a non-material, but positive at EUR 120k, which means that the EBT amounted to EUR 14.8m. Finally, the net profit of the company amounted to EUR 12.2m, a 34.3% YoY increase.
Ericsson NT key financials (Q1 2017 – Q1 2023, EURm*)
Source: Ericsson NT, InterCapital Research
*Converted using CNB’s EUR/HRK average exchange rate for the quarters in question
Ericsson NT also noted that the improvement in net profit levels meant that return on sales (ROS), too, improved and amounted to 8.8% (H1 2022: 6.4%).
Taking a quick look at the balance sheet, the total assets amounted to EUR 163.9m, decreasing by only 1.6% YoY compared to YE 2022, as a result of the lower level of cash and customer receivables. Cash and cash equivalents, which include short-term financial assets, amounted to EUR 65.8m at the end of H1 2023, representing 40.2% of the total assets. They have recorded a decrease of 11% during the first half of the year, which Ericsson notes is in line with regular activities.
In H1 2023, Atlantska Plovidba recorded a sales revenue decrease of 44% YoY, an EBITDA decrease of 65%, and a net income of EUR -1.04m, (H1 2022: EUR 16.9m).
The trends in the shipping industry have been on a downward trajectory for over a year now, under the effect of the war in Ukraine, high inflation and interest rates in the world, and the uncertain future, among other things. This has led to a reduction in demand for shipping, which in this case is reflected in Atlantska Plovidba’s results. According to the Company, they recorded a sales revenue of EUR 22.6m, representing a decrease of 44.2% YoY. This was influenced by the lower average daily rate of USD 12,752, representing a decrease of 41% YoY, with the level in June falling even lower, just slightly below USD 10,000 (June 2022: USD 22,000).
Besides this, the decrease in revenue was also under the influence of a lower amount of transported cargo, which amounted to 2.29m tonnes of cargo in H1 2023, a decrease of 28% YoY. Breaking this down further, coal was the most transported good, amounting to 1.08m tonnes, or 47.3% of the total, followed by minor bulk goods at 677.7k tonnes, or 29.5%, iron ore, at 367.8k tonnes, or 16%, and finally, grain, at 164.3k tonnes, or 7.2% of the total.
In terms of the fleet, Atlantska Plovidba currently possesses 11 ships, with a total transport capacity of 693.121 dwt. Of this, 5 ships are in the Panamax category, 4 ships in the Supramax category, and 2 ships are in the Handy category. Furthermore, Atlantska Plovidba has 2 more ships in construction, in the Kamsarmax category. In H1 2023, the fleet utilization rate was 98.86%, up by almost 2 p.p. YoY. Finally, the NAV of the fleet amounts to USD 202.12m, or on a per share basis, USD 85.12.
Coming back to the financial side, operating expenses amounted to EUR 20.57m, a decrease of 4.9% YoY, mainly due to lower other op. expenses (EUR 3.25m, -22.9% YoY), with material costs remaining almost the same, while staff costs only increased slightly (EUR 4.63m, +2.9% YoY). This led to an EBITDA of EUR 8.76m, a decrease of 65% YoY, implying an EBITDA margin of 38.7%, representing a decrease of over 23 p.p. YoY.
Meanwhile, the net financial result remained negative and amounted to EUR -4.51m (H1 2022: EUR -2.68m), representing a decline of 68% YoY. This came mainly as a result of higher financial expenses (EUR 5.16m, +58% YoY), driven by higher interest rates, higher FX losses, as well as higher other financial expenses. On the other hand, the financial income increased by 10.7% and amounted to EUR 649.9k. All taken together, this led to a net income of EUR -1.04m, (H1 2022: EUR 16.9m), meaning that the net income margin also turned negative, at -2.57% (H1 2022: 41.6%).
Atlantska Plovidba key financials (H1 2023 vs. H1 2022, EURm)
Source: Atlantska Plovidba, InterCapital Research
Taking a quick look at the share price, we can see that during the H1 period, it remained mostly unchanged, and on a YTD basis, it grew by only 1.8%.
Atlantska Plovidba share price development (2019 – 2023 YTD, EUR)
Source: Atlantska Plovidba, InterCapital Research
The final household consumption expenditure decreased by 1.1% (the first quarter for this line to note a decrease!). Further, looking at the mentioned household consumption, it is worth adding that the 1.1% decline is in line with already seen trends, where growth in the previous quarters has already started to decline– as the previous quarters noted a 3.3%, 2.6% and 2.1% growth in this category, respectively.
Household consumption was down in Q2 in line with our expectations, as inflation keeps pressuring on disposable income while savings are melting away. We think that household spending will be close, but above zero level in 2023 and around 3% in 2024 when inflation comes back to more normal levels. Gross fixed capital formation noted a solid single-digit growth of 9.3% (+3.3 p.p. compared to the previous quarter). The changes in inventories had a negative impact on GDP growth. However, the external trade balance contributed by as much as 6.7 p.p. to GDP growth, which completely offset lower domestic expenditure. In total, exports went down by 0.7%, while imports decreased much more pronounced by 8.3% in Q2. The decrease in total exports was driven both by lower export of services (-2.6% YoY) and export of goods (-0.3% YoY) amplifying the overall export decrease. Overall, the external trade balance on services was positive for the fifth consecutive quarter, while the external trade balance on goods return to the negative territory (only the previous quarter in the last two years was an exception). In total, everything abovementioned resulted in 1.4% YoY growth in the total Slovenian GDP.
GDP by expenditures, constant prices, growth rates (%)
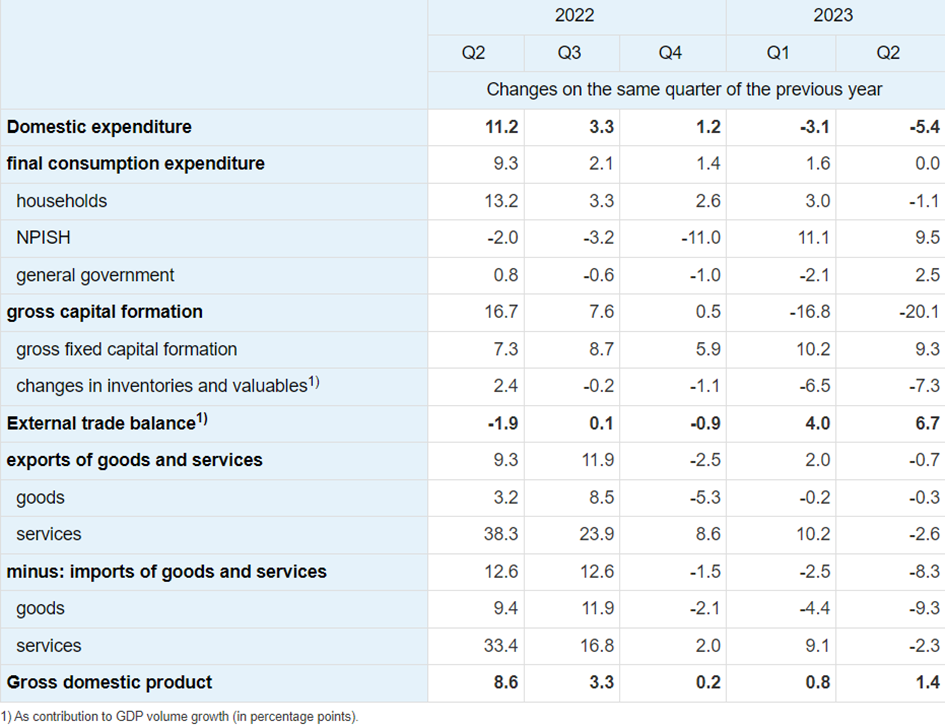
Source: SURS, InterCapital Research
If we were to look at value-added activities at constant prices, construction, Other service activities and Financial & insurance activities contributed the most to the total value added. For these activities, growth in the mentioned value added represent a continuation of a positive trend regarding its contribution to the total GDP.
Besides GDP and values added, the Slovenian statistical office also commented on the Slovenian employment rate trend. During Q2, total employment amounted to 1,093,200 persons, which represents an increase of 1.2% compared to the previous quarter. Most new jobs were created in construction.