It was a busy week with statements from Draghi in Sintra and FOMC pointing out in the direction of monetary accommodation. The markets are expecting more than the FED officials are planning to deliver. Who’s gonna be more wrong – the FED, the markets, … or You?
Happy quadruple witching day! This week’s FOMC meeting went by without any change to the short-term interest target band, however the wording of the statement is strongly tilted towards the prospects of interest rate cuts should the economy continue to show signs of weakness. Looking at the second paragraph of the press release, one could note that this time the wording mentions that “the Committee… will act as appropriate to sustain the expansion…”. In May the same paragraph stated that the Committee “will be patient as it determines the future adjustments to the target range for the federal funds rate” – the choice of words is hence much more hawkish compared to the month before. Interestingly enough, just one day before this hawkish tilt ECB’s Chairman Mario Draghi voiced prospects for the fresh stimulus in the euro area (this comment came from Sintra), which faced a backlash from US President Trump who accused ECB of unfair devaluation of euro. The next FOMC meeting would be held on the last days of July (30th-31st), so if You were hoping for a quiet summer, adjust Your expectations immediately.
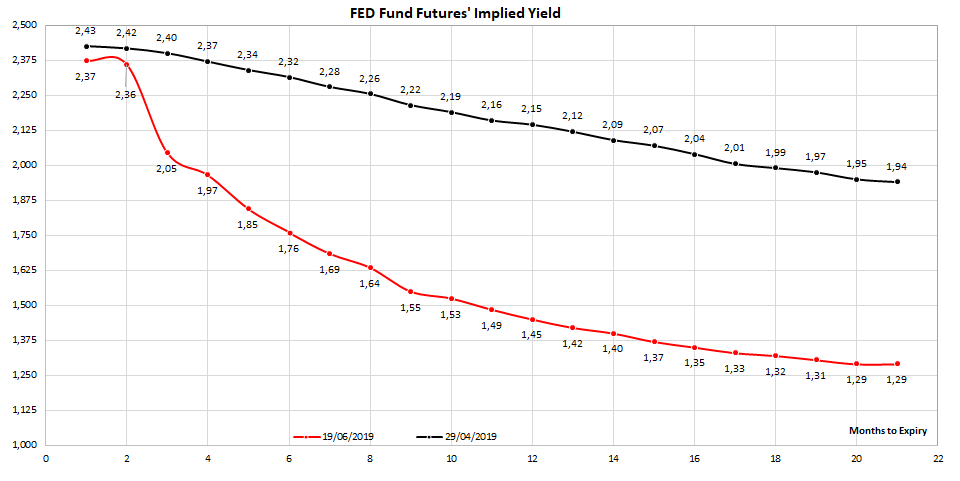
Judging by the financial futures prices (namely FFQ9 Comdty on BBG, the FED fund contract maturing in August, i.e. after the upcoming meeting), at least one interest rate cut is expected in July as the corresponding futures contract is traded at 97.95 (2.05% implied yields, 20.0bps below the lower leg of the FED fund target band). There might be more to come as the December FED fund futures (FFZ9 Comdty on BBG) is traded @ 98.31 (1.69% implied FED fund rate), which would equal three rate cuts before the end of the year. The FED fund curve depicted below becomes flat on the maturity eighteen months from now (end of 2020), with an implied FED fund rate of 1.32%, drafting an expectation of four rate cuts before 2020 draws to a close.
But wait a second… if all of this is expected by the markets, why should we expect any sort of turbulence in the weeks ahead, i.e. shouldn’t we just turn down the cell phone and enjoy the warm weather? Well, not exactly since markets are at odds with the latest DOTS report (You can view it here or simply by entering DOTS on BBG). The median dot is currently @ 2.20% for the end of 2019, implying no change. However, the optics of the dots chart gives a strong impression of the divided FOMC: note that eight members of the seventeen-member committee expect no rate cuts this year, while seven members expect two rate cuts by the turn of the year. The 2020 is even more interesting since no FOMC participants expects any rate cuts by then (i.e. the changes this year would be sufficient to keep recession at bay). Seasoned traders would probably point out a strong change in sentiment compared to March, as well as the tendency of the academics within the Committee to be behind the curve – i.e. historically it was more likely for the FOMC to adapt to the markets than vice versa. Either way, there’s a clear discrepancy between markets’ expectation and FED projections, the one that can be traded upon.
With a solid YTD CROBEX performance, we decided to bring you a short overview of how often CROBEX components outperformed the index since the beginning of the year.
For today we are bringing you an overview of how often the current CROBEX components managed to beat the index since the beginning of the year. For this, we calculated the percentage of times (out of 122 trading days) in which an individual share recorded higher yield than the index.
Percentage of Days When the Share’s Performance Beat CROBEX (YTD)
As visible on the chart below, three out of sixteen shares mostly performed better than the index on a daily basis. The first among them is Valamar, which recorded higher yield than CROBEX 54% of the times. However, the company’s share underperformed the index by 0.9 p.p.
Next comes Optima Telekom, which recorded higher yield than CROBEX 53% of the times, while outperforming it by 219 p.p. (the highest of all components). Ericsson NT follows, observing a higher yield 51% of the times while outperforming the index by 2.3 p.p.
Next comes Adris, whose share price (preferred) observing a higher exactly half of the times. Meanwhile, the share price outperformed the index by 5.1 p.p.
On the flip side, Dalekovod recorded lower yield than CROBEX 57% of the times, which is the highest of all components. It also under-performed the index by 41.7 p.p. (worst of all constituents).
Share Price Performance of CROBEX Components vs CROBEX Performance (YTD)