Is there any hope for bonds? Yesterday Jeffrey Gundlach started tweeting about his DoubleLine adding long bond positions for the last three weeks and we couldn’t help to notice that in the meantime Bloomberg US Treasury Index dropped by about 1.5%. Also, Bloomberg GlobalAgg Bond Index (LEGATRUU Index) lost 21% this year in January-October. Fixed income is s(t)inking. Is it possible that the turning point might be near? Find out in this brief research piece.
The highest inflation prints in four decades may have their origin in goods prices, but by now they have clearly been spilling over into services as well, creating in turn a vicious spiral of rising consumer prices that may linger for a while. Last Thursday US Labour Department said that US headline CPI rose by 8.2% YoY in September, while US core CPI managed to print 6.6% YoY. Core services managed to deliver a 6.7% YoY rise, slightly exceeding the 6.6% YoY rate delivered by the core goods segment. It’s also worth mentioning that the services sector makes up 74% of the annual rise in core CPI. Most of the analysts agree on the notion that core service prices tend to rise more persistently once they are on the move, laying down the groundwork of the narrative that in the near future overall inflation rates are set to remain elevated, but stable because a drop in energy prices would be offset by the growth in core goods/services segment. Once we settle with the new equilibrium on the core side of the equation, overall inflation rates would be poised to drop and FED pivot would probably come sometime after that.
Speaking about the energy side of the consumer price index, currently, weak demand from China (caused by an evident slump in manufacturing) contributes to a gradual decline in commodity prices ranging from crude oil to iron ore. Some of the analysts pointed out that the crude oil market might be under the influence of heavy usage of American SPR drawdowns, which might diminish after midterms (November 08th). However, we would like to point out that weak economic activity in Asia is staying with us even after US midterms, contributing to softer commodity prices. What we really need to focus on are the US core CPI prices, the segment allegedly influenced by monetary policy in general and interest rate hikes/QT in particular.
If you’ve been on the watch for hard economic data and were diligent about how CPI prints affect Fedspeak and subsequent monetary policy decisions, then you probably didn’t miss the fact that with every heavy core CPI print markets push the FED pivot further away in the future. Let’s take a look on how that worked out last week.
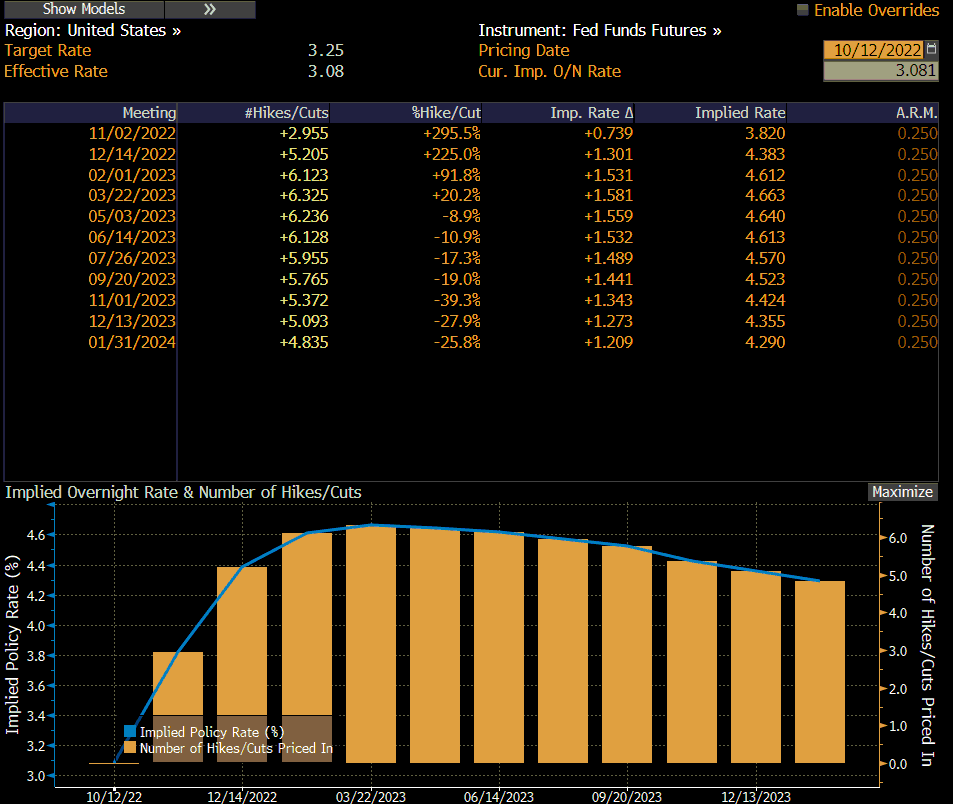
On Wednesday BBG WIRP function was highlighting OIS-implied FED pivot by March 2023 FOMC meeting (March 22nd) when implied O/N rate would reach 4.663%.
Two days later this pivot has been moved to May 03rd meeting and now stands at 4.963%.
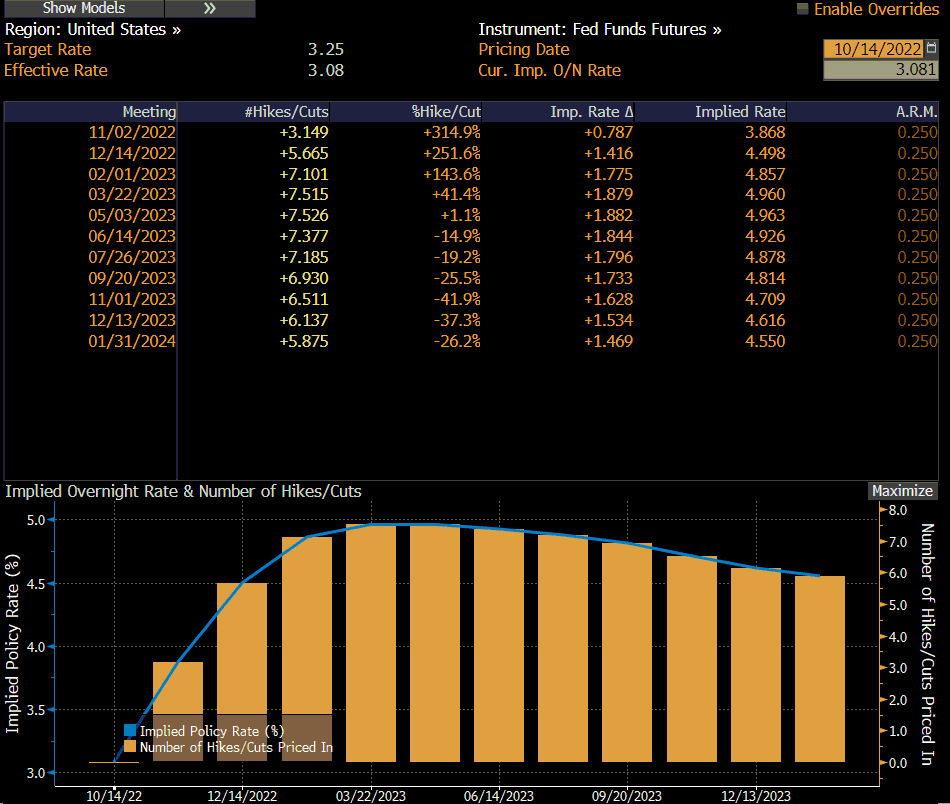
This is the story we have been seeing all year long: with each strong core CPI print, we see markets postponing the FED pivot and consequently raising the terminal rate (in this case from 4.663% to 4.963%). This kicking the can down the road won’t stop until we see a reversal of core inflation. When would that come?
Yesterday’s Beige book (and anecdotal account of the US economy compiled and published by the FED) highlighted several weak spots in the US economy with four districts citing stagnant growth, and an additional two showing outright declines. Still, the Beige book is far away from the word slowdown and overall economic activity was called modest, replacing the word unchanged from the prior edition. We were quite surprised by recent comments from FED’s notorious hawk James Bullard about FOMC slowing down on rate hikes sometime next year. What Bullard essentially said was that with a strong labor market, it would be sound to pull 2023 hikes sooner into 2022 (i.e. it’s prudent to hike sooner, rather than later), which would set the stage for softer hikes next year. Regarding the FED pivot, a very similar message was voiced by DoubleLine’s Jeffrey Gundlach, who claims that he has started building up long positions in USTs. He’s not sure himself when the peak interest rates might happen, but his gut feeling tells him it may be soon.
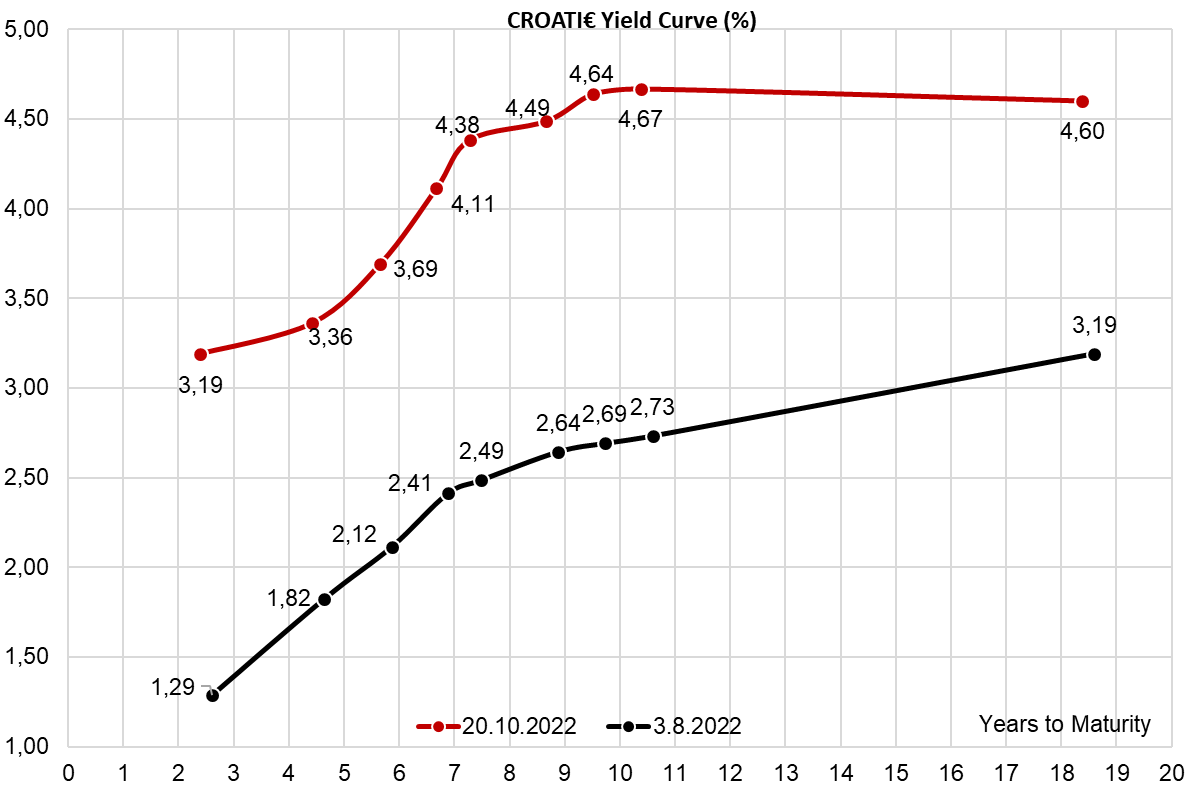
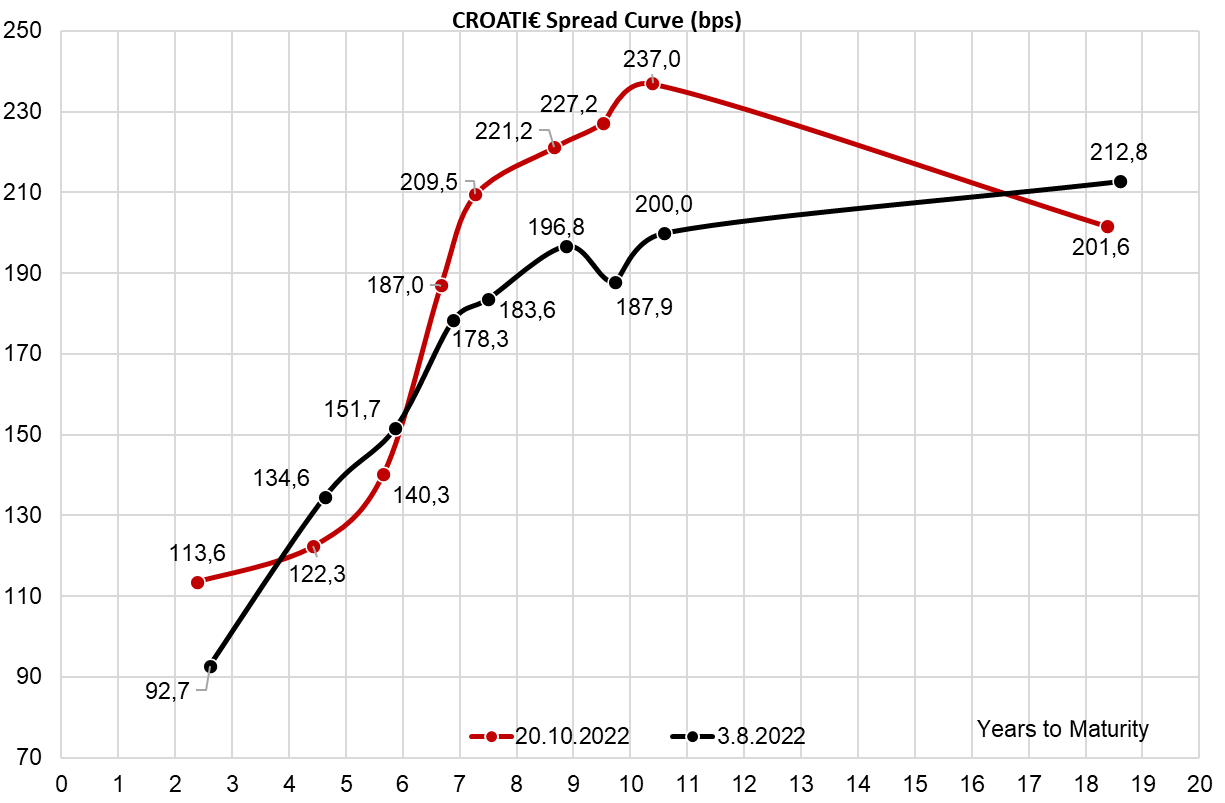
How are Croatian bonds holding up? Yields have continued to move up and with the recent rise in yields, the spreads are set to be contained. What we see on the cash bond side is that several CEE accounts outside Croatia have been loading up on Croatian debt in a move that might have been a switch away from their home countries. In a world of rising yields, Croatia has a much better fundamental picture compared for Hungary, for instance, prompting switching flow away from Hungary and into Croatia. The main issue is that it was rather difficult to find big block buyers of POLAND€ and REPHUN€, which in turn slowed down demand for CROATI€ as well. On the other hand, we see an ample supply of local Croatian paper, which is scooped up from time to time by a bigger buy order coming from asset managers with long-term liabilities. With the current macroeconomic backdrop, we expect Croatian spreads to continue to be well supported and we stick to our thesis that CROATI€ debt is a safe place to be in if properly hedged.
By the end of September 2022, the total assets under management (AUM) of Slovenian mutual funds amounted to EUR 3.86bn, which is a decrease of 10.9% YTD, 5.1% MoM, and 3.1% YoY.
The Slovenian Securities Market Agency (ATVP) has published its latest report on the changes recorded by the Slovenian mutual funds. At the end of September 2022, the mutual funds’ AUM decreased significantly, losing 5.1% of their value MoM, 3.1% YoY, and 10.9% YTD, which would mean that in total, it amounted to EUR 3.86bn. This continues the trend we witnessed last month when the AUM also decreased.
So, what happened exactly? First, the overall macroeconomic situation. Slovenian inflation is still at a high point (+10%) although its growth did start to decelerate (-1 p.p. MoM). Here we can see that despite the growing fears of a recession across the EU but especially in the Eurozone, the situation with inflation did somewhat stabilize for Slovenia, at least for now. However, what did not stabilize is the decline in the prices of Slovenian companies. The main index on the Ljubljana Stock Exchange, SBITOP, declined by almost 15% during September. Considering that shares make up 68.3% of the AUM of Slovenian mutual funds, the decline in their value is directly correlated to the decline in the mutual funds’ AUM. The situation isn’t expected to get better for equity anytime soon either, as the ECB is expected to raise interest rates several more times, which is having a strong impact on companies’ valuations, but also a strong impact on the financial sector, of which several Slovenian blue chip companies (NLB, Sava Re, Triglav) are a part of. Moreover, other companies like Petrol are affected by the current energy market situation, as well as the price caps imposed on them in Slovenia. Furthermore, Krka is also affected as they have 20% of sales in Russia, both directly due to the war but also indirectly as the rouble appreciated significantly during the year.
All of this would mean that the decline in equity was to be expected, and given just how much the mutual funds invest in Slovenian equity, they also lost value. However, it isn’t only that the Slovenian equity lost a lot of value this month, but so did the foreign companies. If we break down the equity holdings of Slovenian mutual funds into home issuers and foreign issuers, both of them lost value this month. The home issuers’ equity securities declined by 12.4% MoM, 22.9% YoY, and amounted to EUR 52.4m. Foreign issuers’ equity securities declined by 6.8% MoM, 5.3% YoY, and amounted to EUR 2.59bn.
Equity holdings of Slovenian UCITS funds (October 2007 – September 2022, EURm)
Despite this, however, if we look at the asset structure of the Slovenian mutual funds, shares still maintain the vast majority at 68.3%, however as mentioned, they did decline, by 1.3 p.p. MoM, and 1.9 p.p. YoY. This would mean that by the end of September, they amounted to EUR 2.64bn. Following them, we have bonds, which amount to 16% of the total AUM, and have gained 0.2 p.p. both on a monthly and yearly basis, amounting to EUR 617m at the end of September. Next up, we have the highest relative gainer, the money market, deposits & cash, which currently holds 9.2% of the total AUM, which is an increase of 1.9 p.p. MoM, and 3.5 p.p. YoY, meaning that they amounted to EUR 354m at the end of September. Finally, investment funds hold 6% of the AUM (or EUR 232m), which is a decrease of 1 p.p. MoM, and 1.7 p.p. YoY.
Total assets of Slovenian mutual funds (June 2007 – September 2022, EURm)
Despite these changes, the net contributions into the funds remained positive, at EUR 21.2m. However, if we look at the last twelve months, the net contributions totaled EUR 318.1m, which is a decrease of 16.1% compared to the same period last year. Meanwhile, the number of subscribers also continued to grow, amounting to 505.9k at the end of the month.
Net contributions into the Slovenian mutual funds (January 2016 – September 2022, EURm)
What can be taken from this data is that despite the severe decline experienced in the equity markets, especially in Slovenia, people are still willing to continue investing in mutual funds, which is after all good news. Also, even though crisis periods present a look of uncertainty and volatility in the markets, these are the periods where most gains can actually be made, and as such, continually investing despite the bad times, will in the long run always yield good returns.