CROBEX has long been known for its broadness which somewhat affected the index’s ability to accurately portray the situation on the market. Therefore, we decided to examine the index’s movement more closely by reviewing the individual contribution of each component in a period spanning from 2013 up until today.
Market indices are supposed to serve as proxies for investors which would allow them to easily follow the direction in which the observed market is moving. However, in order to function properly, the index must be comprised out of shares that attract enough turnover to actually represent the current market movement and not be exposed to frequent price fluctuations. Meanwhile, CROBEX is currently not that type of index as it consists of a large number of shares that many fund managers would not even include in their investment universe (due to extremely low liquidity, poor corporate governance, going in and out of pre-bankruptcy procedures, etc).
The value of the CROBEX index increased by 13.7% in the observed period (Mar 2013- Jun 2022), which might lead some investors to believe that the Croatian market has either missed most of the bull market or that the coronavirus and the current geopolitical situation was able to erase almost an entire decade of gains. Fortunately, none of that is true.
Individual Impact of Shares on CROBEX Movement in the Observed Period (in %)
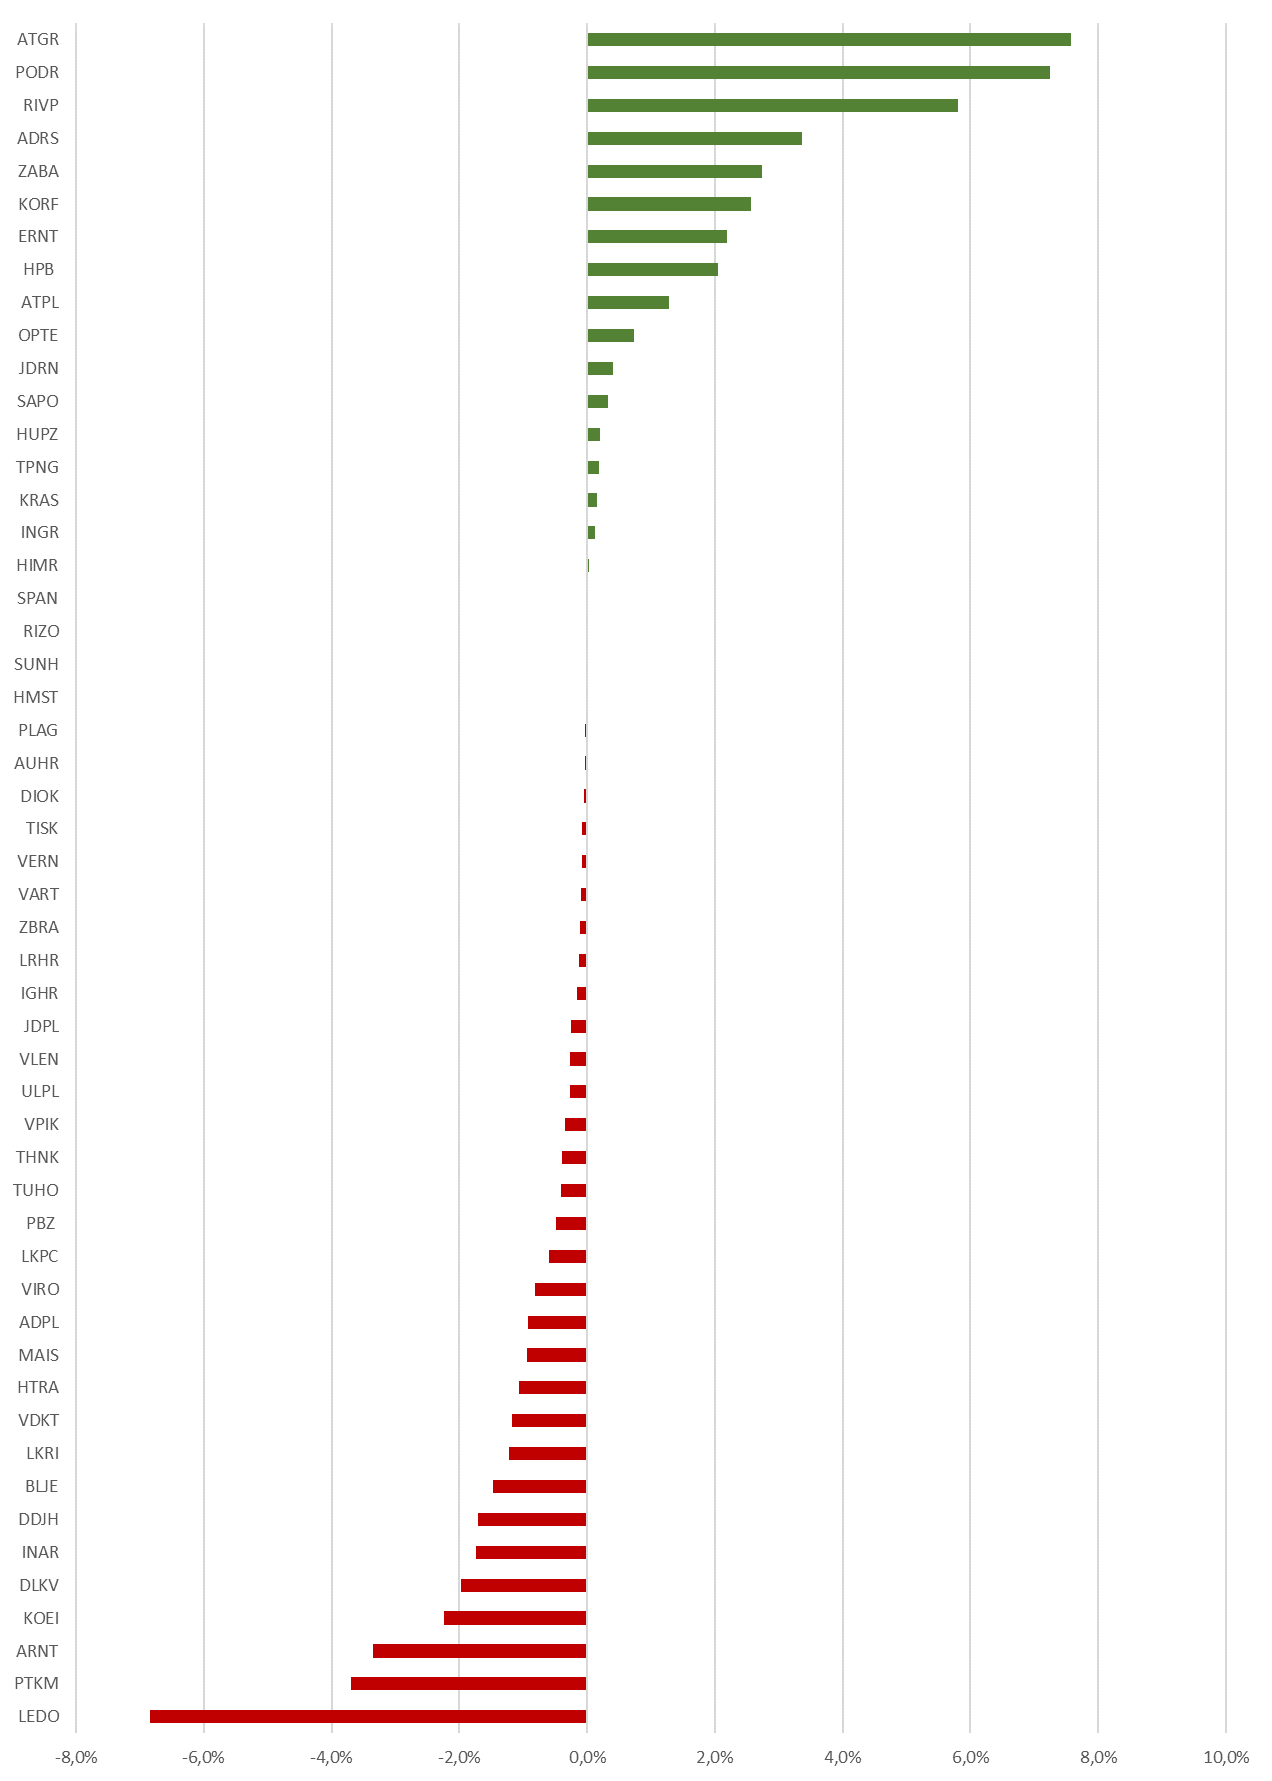
As one can notice, shares such as Atlantic Grupa, Valamar, Podravka and Adris all had a positive impact on the index’s performance. Atlantic Grupa managed to increase its share price by 2.5x in the observed period due to the successful acquisition and integration of Slovenian Droge Kolineske, successful portfolio management and sell-off its non-core assets. Podravka is the second highest contributor to CROBEX’s growth since 2013. Since the beginning of 2019, Podravka’s share price increased by 112.6%, while investor should not forget about the dividend yield one could gain from holding Podravka’s shares. This increase came on good fundamentals, with Podravka increasing its sales and bottom line in the observed period. Podravka is followed by Valamar Riviera, which recorded relatively opposite situation. Most of it’s growth in market capitalization was recorded before 2019. Valamar was materially impacted by corona due to the immobilization of tourists, still recovering from that shock. Considering that these shares are among the most popular shares for investors, the decrease stated previously seems a bit misleading. On the flip side, the shares which dragged the index down were mostly poor-performing companies from the industrial sector which are prone to share price fluctuations due to their low liquidity and poor corporate governance which puts off many institutional investors from buying those shares. Furthermore, the index was hit hard by the Agrokor crisis with Ledo accounting for a 7% decrease in value. An exception from this group would clearly be Končar and Arena Hospitality who, despite the strong interest from investors, were some of the leading contributors to CROBEX’s negative performance. Končar’s negative contribution to the Index happened mostly as a result of the whole market reporting bullish sentiment in those periods. We should mention that Končar’s share price reported a high increase in price during the time Končar was not in the index, overestimating its negative performance in the observed period, even if it did negatively impact the Crobex value. Nevertheless, Končar positively impacted CROBEX due to it’s surge in price in the last year, increasing c. HRK 100kn per share. Also, Dalekovod had a negative influence on CROBEX due to its high indebtness and liquidity problems. In the last quarter we witnessed Končar’s capital increase of Dalekovod, which further diluted Dalekovod’s price.
To conclude, the Croatian market has certainly been through a rough patch over the past couple of years. However, we believe that the performance of the main market index is slightly exaggerated as its broad size led to the inclusion of shares which unjustifiably dragged it further down. Therefore, we believe that despite the underperformance of the index, the Croatian market still offers some gems hidden in the pile.
Pursuant to the Instructions for Indices, Liquidity Criteria, Price List and other Statistics a quarterly review of index calculation parameters of the SBITOP and SBITR was carried out and the index weighting factor of an issue of shares index was established. Further, currently only Salus is on New Watch list for exclusion from SBITOP composition, while no candidate is considered to be included
New calculation parameters will be valid from Monday, 20 June 2022.
In addition, LJSE announced candidates for inclusion into or exclusion from the SBITOP and SBITR indices. Currently, only Salus is on New Watch list for exclusion, while no candidate is yet considered to be included.
| wdt_ID | Ticker | Index free float capitalisation (in EUR) | Weight (%) |
|---|---|---|---|
| 1 | KRKG | 887.923.268,48 | 29,60 |
| 2 | PETG | 620.883.177,60 | 20,70 |
| 3 | NLBR | 459.200.000,00 | 15,30 |
| 4 | ZVTG | 302.832.171,36 | 10,10 |
| 5 | POSR | 193.962.272,77 | 6,50 |
| 6 | CICG | 142.203.952,00 | 4,70 |
| 7 | LKPG | 134.064.000,00 | 4,50 |
| 8 | SALR | 130.051.250,00 | 4,30 |
| 9 | TLSG | 116.070.089,28 | 3,90 |
| 10 | UKIG | 12.449.283,80 | 0,40 |
The highest growth in the CPI was recorded in the transport prices, which increased by 19%, followed by Food and non-alcoholic beverages, which grew by 15.2%, and Restaurants and hotels, which increased by 12.1% YoY.
The Croatian Bureau of Statistics has published the monthly report on the developments of the Croatian CPI (Consumer price indices) for May 2022. Looking at the MoM data first, the prices of goods and services for personal consumption, increased by 1.4% on average. On a YoY basis, the CPI increased by 10.8% on average, while on the annual average it grew by 5.4%. The 10.8% YoY growth in the CPI marks one of the largest increases ever recorded in Croatia and continues the trend of increasing inflation that has started in the 2nd half of 2021.
CPI (January 2013 – May 2022, %)
Furthermore, if we were to look at the biggest contributors to this increase on an annual level, it was recorded in the following segments: Transport prices, which grew by 19% YoY, Food and non-alcoholic beverage prices, which increased by 15.2%, Restaurant and hotels, which grew by 12.1%, Furnishings, household equipment, and routine household maintenance, which increased by 11.7%. The story does not get better the further along we go, as the remaining categories all recorded an increase in prices of over 5%, with Housing, water, electricity, gas, and other fuels growing by 9.2%, Clothing and footwear growing by 8.9%, Recreation and culture by 6.6%, and finally, Miscellaneous goods and services by 6.2%.
Even though there has been a steady increase in inflation over the last couple of months, this month’s increase is profound as it recorded growth in inflation across all categories and growth that is not insignificant. The increase in transport and food prices is particularly significant, and even though these were the main drivers of the inflation since it started spiking in late 2021, a 19% and 15.2% increase YoY is considerable. Taking into account the gradual embargo of the Russian oil imports into the EU during 2022, as well as the current war in Ukraine threatening food supply, especially when it comes to wheat, sunflower, and other similar food, if the situation does not resolve itself, it is expected that inflation will only continue growing. Since this is a first month of double digit annual increase in prices, we can say that we expect that this trend should subside towards the year end in order for us to have single digit inflation growth in 2022.
At the same time, the increases across other categories mean that all industries are affected, something that has thus far proven not to be the case, at least not significantly. It should also be noted that the 3rd largest increase recorded, Restaurants and hotels can be attributed to the fact that the pandemic-related measures are completely gone. As May is usually considered „pre-season“ for Croatian tourism, and with high expectations for a good summer season with increased bookings similar to (or higher than) 2019, the growth in this category is also expected.
Taking a look at the largest contributors to the growth rate on the annual basis, Food and non-alcoholic beverages contributed 3.94 p.p., Transport 2.8 p.p., Housing, water, electricity, gas and other fuels 1.55 p.p., Furnishings, household equipment and routine maintenance contributed 0.67 p.p., Restaurants and hotels 0.6 p.p., while Clothing and footwear 0.52 p.p.
At the monthly level, the highest increase was recorded in Transport prices (+3%), followed by Food and non-alcoholic beverages (+2.1%), Furnishings, household equipment and routine household maintenance (+1.5%), Recreation and culture (+1.4%).
CPI change by categories – May 2022 (YoY, %)
Finally, looking at the CPI by selected groups, Goods increased by 13.2% YoY, Services by 4%, Energy by 21.5%, and Food, beverages and tobacco by 12.9%. The total increase without energy was 8.7%, while without energy and food, it was 5.9%.