Since 2020 was a roller coaster ride for most Stock Exchanges with investors selling their shares at the beginning of the year, only to acquire new, booming ones in the second half, we decided to check what kind of an impact did this unexpected volatility have on the average daily turnover of regional Stock Exchanges.
Let’s start a little while back. For years now, most regional Stock Exchanges were unflatteringly cited as being of poor liquidity by both domestic and foreign investors since most of them never regained the liquidity witnessed prior to the financial crisis. This can be observed in the table below where one can easily notice that all Stock Exchanges have been posting declining average daily turnovers throughout the observed period, with some years acting as outliers where IPOs or local circumstances drove trading activity upwards.
Average Daily Turnover of Regional Stock Exchanges (in EURm)
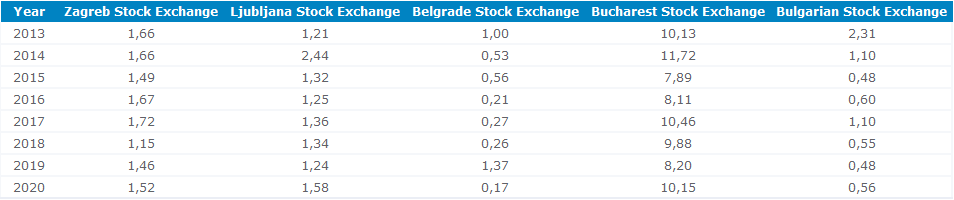
Source: InterCapital Research
As seen from the table, all but one of the observed regional Stock Exchanges witnessed an increase in their respective average daily turnover in 2020. Among them, the largest YoY increase was witnessed by the Ljubljana Stock Exchange whose average daily turnover rose by 27% YoY. This sharp increase can largely be attributed to the incredible increase in turnover recorded by Krka. Namely, Krka’s turnover in 2020 increased by 48% YoY (including block transactions). However, that isn’t all, Krka’s 2020 turnover actually amounted to an incredible 47% of the Ljubljana Stock Exchange’s total equity turnover. True, it was as high as 42% in 2019, but still, a fun fact definitely worth mentioning.
In second place comes Romania, whose average daily turnover went up by 24% YoY in 2020. Along with the volatility caused by the COVID-19 pandemic, the inclusion of the Romanian capital market into the Emerging Market surely played a significant role in the liquidity increase. Meanwhile Bulgaria’s average daily turnover went up by 17% YoY.
Croatia witnessed an increase of just 4%, thus remaining rather flattish when compared to double digit growth of other regional Stock Exchanges. However, there are some things worth pointing out here. For one, the base in 2019 was somewhat higher than it normally would be since 2019 was marked by the strong interest in Optima Telekom amid speculations of a potential sale and the takeover of Kras. Second, all but one of CROBEXprime members recorded double digit turnover growth, meaning that investors interest is seriously shifting towards blue-chip companies. If you are wondering which one of the prime market components did not see their turnover rise, it was Atlantic Grupa whose turnover fell by -23% YoY. However, note that the decrease was primarily due to lower block transactions, while their regular turnover soared 58% YoY.
On the flip side, the obvious laggard was the Belgrade Stock Exchange whose average daily turnover plummeted in 2020, amounting to a mere EUR 0.17m (-88% YoY). However, note that such a large drop was due to a one-off which occurred in 2019. Namely, in 2019 the Serbian Government was obligated to purchase over EUR 200m worth of Komercijalna Banka shares due to a put option it had with the previous shareholders. Still, even if we compare the average turnover to the one recorded in 2018, we still get a decrease of -35%.
The VIX has been relatively flat since the beginning of the year and is currently at one of the lowest values since the outbreak of the pandemic.
Following an unusual election, to say the least, the United States is welcoming today their new President, Joe Biden. As the inauguration of the Democratic candidate is taking place in a very specific time of an ongoing pandemic and political tensions, we decided to look at the VIX.
The VIX has been in the spotlight since the outbreak of the pandemic, as equities have witnessed significant volatility in 2020. Also known as the fear index, VIX is calculated based on the S&P 500 options and reflects market expectations on (implied) volatility in the coming 30 days. Unlike classic indices, VIX’s growth represents negative sentiment or increased risk of market volatility. VIX levels over 30 could be considered risky as the market is expecting high volatility.
The main US equity indices observed an almost uninterrupted rally from its March lows and have closed a turbulent 2020 on all time highs, with Nasdaq100 leading the gainers with an increase of more than 40%. Meanwhile S&P has observed a solid increase of 16% in 2020.
Performance of VIX Since the Beginning of 2020
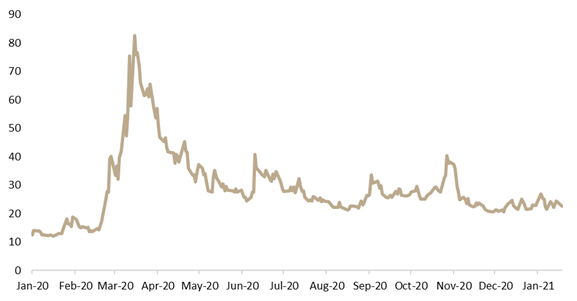
Source: Bloomberg, InterCapital Research
Since, the S&P and VIX are negatively related, 2020 market conditions have led to a surge in the VIX index. It is worth noting that VIX was last time seen at the levels observed this year during the financial crisis in 2008. In March 2020 VIX observed two sharp daily increases. The first one was on 12 March, which coincided with President Trump introducing the European travel ban. Meanwhile, on 16 March the index reached 82.69, which is the highest value since the CBOE (Chicago Board Options Exchange) introduced the new methodology for the index in 2003.
As visible from the graph below, not so long ago VIX reached as high as 40.28, days before the US elections, and has since than been gradually declining. Since than Joe Biden has been elected as the 46th president of United States while Pfizer and Moderna have shown positive vaccine development. As visible from the graph, the VIX has been relatively flat (mid 20s) since the beginning of the year and is currently at one of the lowest values since the outbreak of the pandemic (23.24).