Every crisis which affects capital markets gives us a chance to revisit and relearn certain ideas which might help us navigate in the future. The Covid-19 crisis in that regard is no different than all of the prior witnessed crises. Therefore, for today we decided to point out 3 lessons (re)learned so far during this crisis.
During a crisis it is valuable to see if there are any commonalities between stocks which underperformed and those which outperformed. Stocks which find their place in any of the mentioned categories usually tend to have some commonalities, which tend to be quite intuitive.
I) FLEXIBILITY MATTERS
The Covid-19 crisis confirmed the value of flexibility as more flexible companies (on a global level) witnessed significantly better share price performances than less flexible ones. To be specific, three types of flexibility seemed to be crucial for companies: investment flexibility, operating flexibility and financing flexibility.
Investment flexibility in a sense measures how much a company needs to invest to get a given level of growth and how long a company needs to wait. The more a company needs to invest and the longer it needs to wait to achieve a certain level of growth, the less investment flexible it is (for ex. heavy infrastructure companies). A solid proxy for seeing how flexible a company is in this respect is calculating the sales to invested capital ratio. In the graph below you can observe the breakdown of global companies based on sales/capital ratio, which clearly shows a positive correlation between low investment flexibility and a poor share price performance (and vice versa).
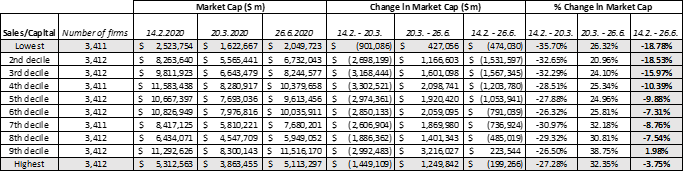
Source: Aswath Damodaran, InterCapital Research
Operating flexibility measures how much your operating income is affected by a given change in revenues. Such flexibility was (and still is) particularly important in this crisis as the vast majority of companies observed a shock to their revenues to some extent. The main driver of the operating flexibility of a company is its cost structure, meaning that a revenue shock to a company with a higher share of fixed costs will lead to a much higher shock on the company’s EBITDA and operating profit than it would to a company with a higher share of variable expenses. A solid example of a sector with very low operating flexibility would be airlines, whose revenues were significantly hit during this crisis, but the share of operating expenses remained fixed.
Measuring a company’s operating flexibility is quite challenging as it is difficult to estimate the share of fixed and variable operating expenses for certain companies. Damodaran for this used gross margin as a proxy as higher gross margin allows more room for a revenue shock. Although we can not conclude much from the graph below, it seems that globally companies with a higher gross margin have performed much better.
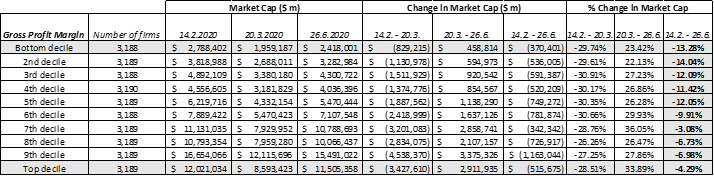
Source: Aswath Damodaran, InterCapital Research
Financing flexibility measures how much net income changes for a given change in operating income. There are two main drivers of financing flexibility – how much debt a company decides to take and how much cash it decides to hold. Intuitively, companies with a lot of debt and not a lot of cash have very low financing flexibility. A solid representation of the financing flexibility is the net debt/EBITDA, which once again showed that companies with a higher net debt/EBITDA were hurt more that the one with a lower ratio.

Source: Aswath Damodaran, InterCapital Research
II) VALUE PERFORMED WORSE THAN GROWTH
This crisis also brought yet another debate on value vs growth investing and resulted in some interesting points. If we were to look at the US market and define value as a low P/E and P/B and growth as high P/E and P/B, one can notice that for the past 6 decades (by decade) value stocks have almost always outperformed growth stocks with the exception of 1990s (dot com boom). However, in 2010s we observed a reversal in the US, where growth outperformed value stocks (with an emphasis on FAANG stocks).
If we were to look at how these categories performed during this crisis, we reach an interesting conclusion. As visible from the table, what is considered as traditionally less risky (low P/E, low P/B, high dividend yield, low growth) has significantly underperformed since the outbreak of the pandemic. In that sense, this crisis is not like the previous ones. Note that the table represents the percentage change in collective market cap of top decile in its respective grouping.
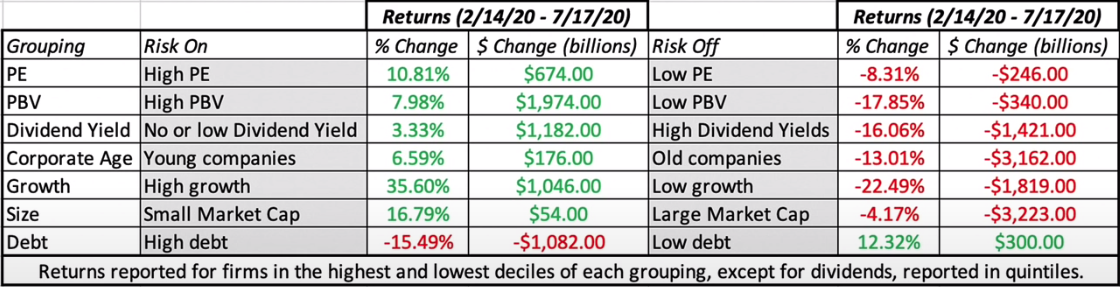
Source: Aswath Damodaran, InterCapital Research
III) HIGH CASH RETURNING COMPANIES PERFORMED WORSE
A company’s dividend and buyback policy to a certain extent reflects the confidence to generate projected earnings and cash flows. Therefore, if companies lack or reduced their confidence of generating their projected earnings, they might revisit their dividend policy, reduce the dividend payment or stop buybacks. The Covid-19 outbreak has definitely had a negative effect on most companies projected earnings, which in turn led a halt in buybacks and dividend payments for many companies in 2020. As visible from the table, the high dividend yield companies performed worse than low dividend yield or non-dividend paying companies. If we were to include buybacks in the equation, we observed the same trend. However, the companies that only buyback stocks performed better than the ones only paying out dividends. This does not surprise us given that dividend payments are “sticky” while it is easier to stop buybacks without the share price being significantly punished by the investors.
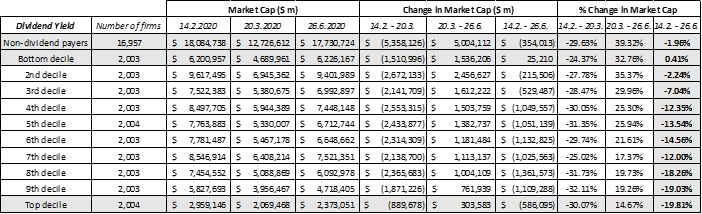
Source: Aswath Damodaran, InterCapital Research
As of July 2020, Slovenian mutual funds manage EUR 2.903bn, representing an increase of 0.7% MoM and a decrease of 3.9% YTD.
For today, we decided to present you with a short asset structure analysis of Slovenian mutual funds. When looking at the graph below, one can notice that the Slovenian mutual funds have not significantly changed their assets structure during COVID-19 crisis.
As of July 2020, Slovenian mutual funds manage EUR 2.903bn, observing an increase of 2.5% YoY or +0.7% MoM. It is worth noting that mutual funds are experiencing a recovery after a considerable loss in March 2020 (-12.4% MoM) due to crisis caused by the Covid-19 pandemic. As a reminder, in April the AUM partially recovered with a 7.8% increase. Meanwhile, on a YTD basis, AUM is only 3.9% down, indicating that the investors were not withdrawing funds at a significant level during the Covid-19 outbreak, which was not the case in Croatia.
Turning our attention to the asset structure, as of July 2020, shares account for 67% of the total assets, which is slightly below the historic average of 70% (in the observed period). Note that the vast majority (97%) of equity holdings of Slovenian mutual funds come from the foreign market. Next come bonds, which make up for 19% of the total asset structure or EUR 551.3m. Of that, 93% come from the foreign market. Investment funds’ share in AUM amounts to 6.8% of total assets, while money market, deposits & cash account for 6.6%. In nominal terms, shares have observed a decrease of EUR 124.39m since the beginning of the year, which was partially offset by an increase in bonds by EUR 29.3m and Money market, deposits & cash by EUR 24.2m.
Total Assets of All Slovenian UCITS Funds (2007 – July 2020) (EUR bn)
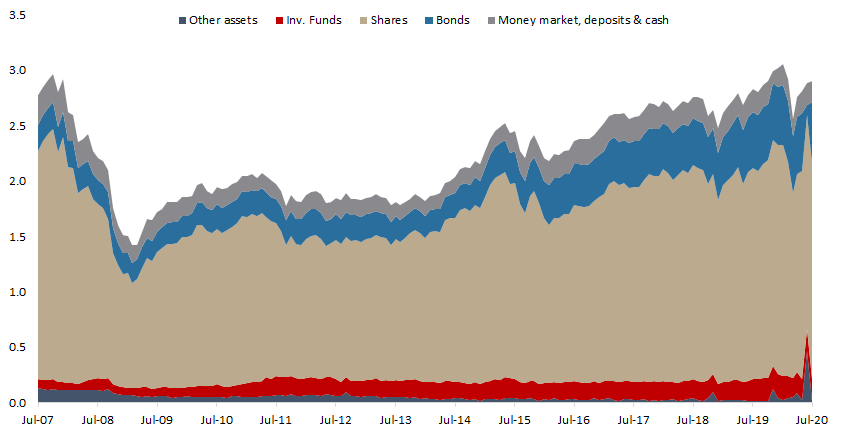
Source: Securities Market Agency, InterCapital Research
Yesterday, VIX closed at 22.54, one of the lowest levels since the outbreak of the pandemic.
The VIX has definitely been in the spotlight this year, as the global markets have witnessed significant volatility as a result of the Covid-19 pandemic. VIX, also known as the fear index, is calculated based on the S&P 500 options and reflects market expectations on (implied) volatility in the coming 30 days.
Unlike classic indexes, VIX’s growth represents negative sentiment or increased risk of market volatility. VIX levels over 30 could be considered risky as the market is expecting high volatility.
The performance of US indices Dow Jones and S&P 500 was further boosted in July and August (so far) which came on the back of the continued positive sentiment on the equity market. On a YTD basis, Dow Jones is down only 3%, while the S&P 500 has fully recovered and is up 4.5%. Meanwhile, earlier this year, both indices observed a decrease higher than 20% in less than a month (compared to the 52-week peak) witnessing the fastest bear market in history.
YTD Performance of VIX
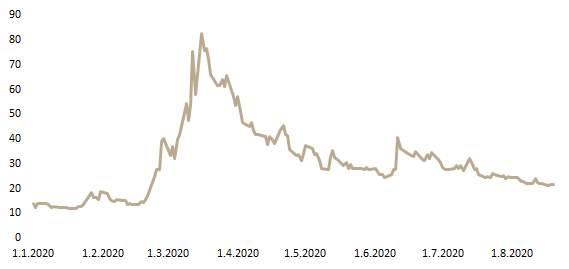
Since, the S&P and VIX are negatively related, this year’s market conditions (the combination of Covid-19 outbreak and an oil price war between Russia and Saudi Arabia) have led to a surge in the VIX index. It is worth noting that VIX was last time seen at the levels observed this year during the financial crisis in 2008. In March, VIX observed two sharp daily increases this month. The first one was on 12 March, which coincided with President Trump introducing the European travel ban. Meanwhile, on 16 March the index reached 82.69, which is the highest value since the CBOE (Chicago Board Options Exchange) introduced the new methodology for the index in 2003.
Since the beginning of the year, VIX has increased by 63.6% and currently stands at 22.54. However, since its peak in March the index has been gradually decreasing as the sentiment on the equity market has continued, while the current level is one of the lowest levels since the outbreak of the pandemic.
VIX vs S&P500 (2003 – 19 Aug 2020)*
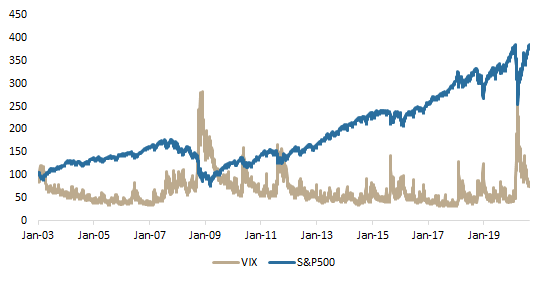
*indexed value relative to base year (2003)