Today we decided to update performances of the regional, frontier and emerging market indices in order to put CROBEX’s performance from the beginning of the year into perspective. Furthermore, we compared the historical movement of CROBEX performance to “fear index” VIX in order to analyse whether the domestic index follows global sentiment.
Since, the S&P and VIX are negatively related, the recent market conditions (the combination of Covid-19 outbreak and an oil price war between Russia and Saudi Arabia) have led to a surge in the VIX index. However, as the S&P index has been rising steadily the past couple of weeks, the VIX index has been decreasing recently. Since the beginning of the year, VIX is up 177%, and currently stands at 38.15. Although this sounds worrisome, one should note that a month ago the VIX index amounted to 82.69, which is the highest value since the CBOE (Chicago Board Options Exchange) introduced the new methodology for the index in 2003.
VIX Movement YTD
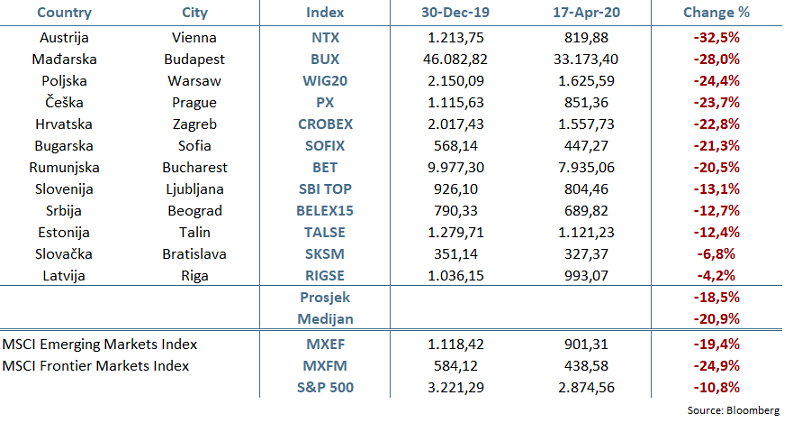
Turning our attention to the region, all indices posted a negative YTD performance with the average value decrease amounting to -18.5%. The Austrian NTX index recorded a -32.5% YTD decrase in value which makes it the biggest laggard among the observed indices. Afterwards come the Hungarian BUX (-28%) and the Polish WIG20 (-24.4%). Meanwhile the Latvian RIGSE index and the Slovakian SKSM index were the only indices to record single digit loses, amounting to -4.2% and -6.8%, respectively.
For today we decided to look at EBITDA and net profit margins of Croatian companies, for which we used 2019 figures.
It is important to note that comparing the margins across the selected companies is not necessarily the best way to do the comparison as many companies operate in different industries. Since both EBITDA and profit margin reflect to a great extent the industry in which the company operates in, we advise to compare it to the peer average or median. Nevertheless, it is still worth seeing which Croatian companies are more profitable and therefore have more “room” to potentially reduce the prices of their goods or services if needed, while still remaining a higher level of profitability.
EBITDA margin of Selected Croatian Companies (%)
Having said that, it comes as a no surprise that HT recorded the highest EBITDA margin of 41%, which is also above the regional industry average (based on the companies in our wider coverage) of 33.6%. Next come 2 tourism companies – Maistra and Valamar Riviera which operate with an EBITDA margin of 35.4% and 34.8%, respectively. On the flip side, Končar has the lowest EBITDA margin of 5.86%.
Turning our attention to the profit margin, 3 tourist companies lead the list – Arena Hospitality Group with 18.95%, Valamar Riviera with 13.85% and Maistra with 12.46%. On the flip side, Kraš has the lowest profit margin of 1.51% (and EBITDA margin of 9.98%), which is quite low given the industry it operates in.
High net margin can be a result of high operating profitability but it can also be influenced by taxes. This was the case in 2019 with Arena and Valamar who had received tax benefits related to their investments in capacity reconstruction. Based on Croatian Act on Investment Promotion, the company can obtain tax relief for investments realized. Due to these incentives in 2019 Arena had realized HRK 40.2m of profit tax income, while Valamar had realized HRK 73.4m of profit tax income. Maistra, that had in 2019 opened its premium five start flag-ship hotel Grand Hotel Park, in its preliminary financial results for 2019 showed income tax expense of HRK 25.6m. On the other hand, Maistra had in 2018 booked HRK 103.4m of profit tax income as majority of investments into its premium hotel was done in 2017 and 2018. In 2018 Maistra’s profit margin had amounted to 24%.
If you wish to compare EBITDA and net profit margins of these companies to their regional sector peers, you can do so by looking at our daily trading multiples which can be found here.
Profit margin of Selected Croatian Companies (%)
For today we decided to present you with a brief analysis of the interest coverage ratio of Croatian companies.
For this we used 2019 figures. Interest coverage ratio is used as a measure which gives us an insight on the company’s ability to meet its interest payments. The ratio is calculated by dividing the company’s operating profit by the interest expenses. Therefore, a higher ratio indicates that the company is less burdened by debt and the other way around.
Interest Coverage Ratio of Selected Croatian Companies
As visible in the graph Ericsson NT operates with the highest interest coverage ratio of 68.04, which does not come as a surprise given that the company operates with low debt. Next come two Food companies, Podravka and Atlantic with an interest coverage ratio of 17.9 and 14.21, respectively. Both companies operate with also low debt, as net debt/EBITDA of these companies amounts to 1.57 and 1.17, respectively.
On the flip side, of the observed companies, Atlantska Plovidba operates with the lowest interest coverage ratio of 1, indicating that the debt payments present a big burden for the company relative to its operations.
To read our analysis of indebtedness of Croatian companies, click here.
To read about how much cash per share do Croatian blue chips have, click here.