The FED expects inflation figures to pick up throughout the year and hence no significant move was telegraphed on yesterday’s FOMC statement. On the other side of the world, Croatia got an outlook upgrade last Friday from Moody’s, but the rating itself remained unchanged at Ba2 (equal to BB in S&P/Fitch terms), two notches below investment grade. Oh, and have You noticed that according to Moody’s there isn’t a single country rated Ba1 (BB+ in equivalent terms)? Investment grade might be closer than You think…
In December the PCE core change has been @ 1.95% and in the first three months of 2019 this inflation gauge has drifted away (1.6% YoY in March) from FED’s target (2.0% YoY); according to yesterday’s FOMC statement, that doesn’t concern the FED very much. Markets think the same way as the FED does since 5Y5Y inflation swap rests @ 2.25% (FWISUS55 Index on Bloomberg), and the FOMC deemed the factors at work as “transitory”. Also, it seems that issuance of US government securities and tax receipts kicked off cash hoarding of financial institutions into the central bank account, so the FOMC acted to cut the upper bound by some 5bps. Apart from these two things, there wasn’t much signal about the direction of interest rates and at this point it seems that we have a divided FOMC. Markets haven’t reacted that much to the FOMC statement – 10Y Treasuries edged upwards in the wake of the statement (probably to traders betting on an increase of rate cut probability) but erased all of the gains after it became clear the FED sticks to it’s belief that inflation trend would eventually turn around. The FED fund futures haven’t made any significant move at all, and the January 2020 FED fund futures trades at an implied yield of 2.225% (“FFF0 Comdty” on Bloomberg) – hence the market bets that the next move is going to be a cut, and it’s getting closer and closer.
Now to a more local news – after Standard & Poor’s Global Ratings decided to bring Croatian sovereign rating back into investment class (March 21st), on Friday Moody’s made a step in the same direction and changed the outlook from stable to positive. The rating itself has remained unchanged at Ba2 – the same level as Georgia and Azerbaijan, two notches below Romania, Russia and Hungary; still the outlook upgrade is certainly a step in the right direction. The agency praised Croatian efforts to bring the pension system in check, as well as recently achieved budget surpluses which managed to overcome challenges such as Agrokor (2017) and shipyards (2018). Apart from the fiscal blueprint, solid GDP growth figures are likely to continue in 2019-20, when GDP growth is expected to settle around 2.4% YoY (corresponding to potential GDP growth). The agency also mentions that tourism makes up 20% of GDP and about 35% of export revenues, making Croatian economic output sensitive to less favourable external environment, but country’s firm anchoring on the European tourism landscape raises the certainty that tourist inflows will continue in future as well. Finally, the process of accession into the euro area serves as a policy anchor and would contribute to further institutional reform. The agency mentioned that Croatia still has an above Ba-median public debt relative to GDP (very high share of FX debt is also a reason for concern), but the trend is favourable and by 2020 this ratio will likely drop to about 70% GDP. So not quite investment grade, but we’re getting there.
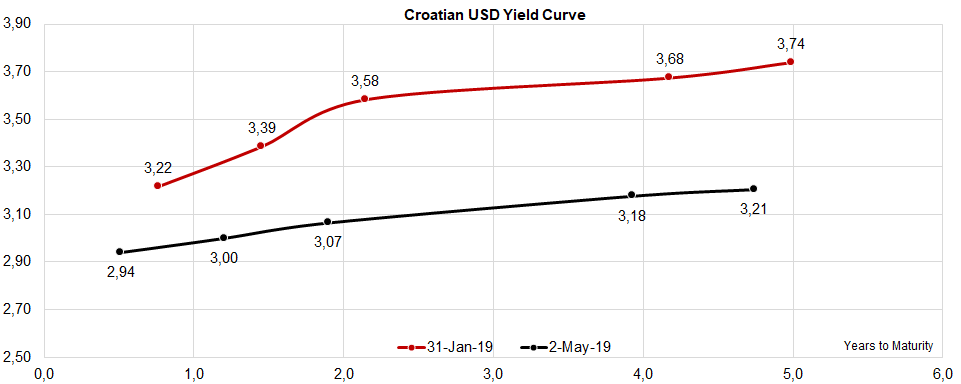
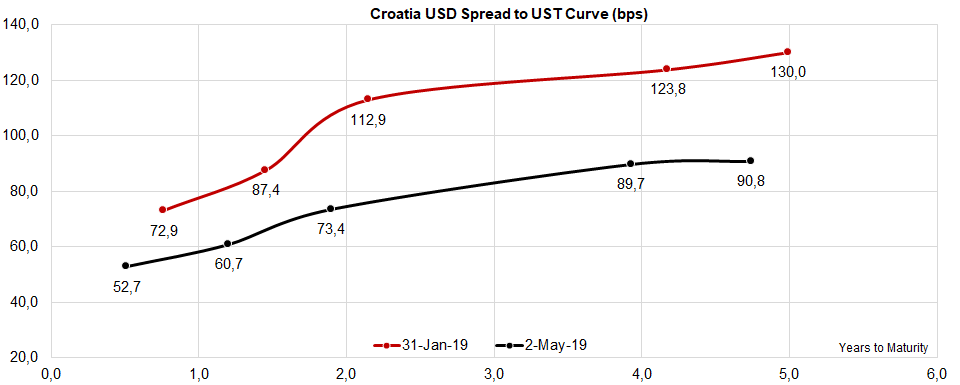
Croatian Eurobonds haven’t changed this morning and it’s worth noting that the shortest Croatian USD international bond trades at YTM below 3.00% for quite some time. The best executable bid on the market is 101.85 (2.97%), but with a bit of patience and luck sellers might get 101.95 (2.78% YTM). What to do with the proceeds is a question worth pondering because the USD curve is as flat as it gets – but from the G-spread perspective CROATIA 2023 USD might be the place to be as it offers some 90bps premium on the US paper of equal maturity. Also, looking back at the yield curve, CROATIA 2023 USD gives 5.5bps of extra yield on every year of additional duration (3.18% – 3.07%, divided by two), but the steepness is still higher between CROATIA 2020 USD and CROATIA 2021 USD.
In Q1 the company recorded increase in sales of 13.2% YoY, decrease in EBITDA of 30% and a decrease in net income of 63.4%.
In Q1 2019, Končar reported sales of HRK 606.6m, which represents an increase of 13.2% YoY. Meanwhile operating revenues increased by 8.2%, amounting to HRK 623.7m. When observing the revenues by segment, exports made for 65% of the operating revenues. Looking at individual markets, exports to Sweden recorded HRK 49.5m, to Germany recorded HRK 46.8m, to U.A.E recorded HRK 42.2m, to Austria recorded HRK 33.2m and to the Netherlands recorded HRK 26.3m.
The whole foreign market observed an increase of 27% YoY, amounting to HRK 394.7m. On the domestic market, the company observed a decrease of 5.9%, amounting to 211.9m. Of that, HRK 65.8m represents sales of goods and services to members of HEP.
In Q1, Končar contacted new deals worth HRK 759.4m, which represents an increase of 16.6%. Of that, 30% was contracted on the domestic market, while 70% on the foreign market. In 2019, HRK 698.3m of the mentioned deals will be realized, while the rest will be realized in the following years.
Operating Revenues (Q1 2019 vs Q1 2018) (HRK m)
Going Further down the P&L, the company observed an increase in operating expenses of 11%, amounting to HRK 617.8m. The increase could be mostly attributed to the rise in material costs of HRK 30.4m and changes in inventories of work in progress and finished goods which went from HRK -70m in Q1 2018 to HRK -37.5m.
Consequently, EBITDA observed a decrease of 30%, amounting to HRK 29.3m.
In Q1 the company realized a net financial gain of HRK 2.5m, compared to Q1 2018 when they recorded a loss of HRK 7m.
Net income amounted to HRK 5m, which represents a decrease of 63.4% YoY.
EBITDA & Net Income (Q1 2019 vs Q1 2018) (HRK m)
In Q1 2019, the company recorded an increase in net interest income of 6.3%, increase in net fees and commisions of 16.5% and an increase in net income of 14.5%.
As ZABA published their Q1 2019 report, we are bringing you key takes from it. According to the report, the company observed an increase of 6.3% in net interest income, amounting to HRK 883.9m. The increase came as a result of stable average credit volume and lower financing costs.
Further, net fee and commission income amounted to HRK 377.4m, which represents an increase of 16.5%. Such an increase could be attributed to a rise in asset management fees and investment banking fees. Meanwhile, net banking fees recorded an increase of 13.8%, amounting to HRK 1.35bn.
Going further down the P&L, value adjustments and provisions amounted to HRK 139m, which represents an increase of 73.8%. In Q1, net income amounted to HRK 537.3m, which represents an increase of 14.5%.
Turning our attention to loans and deposits, ZABA observed a slight increase in loans to customers of 0.3% which amounted to HRK 81.8bn. Deposits to customers, on the other hand, increased by 2.4%, amounting to HRK 104.9bn. Consequently, the company observed a decrease in L/D ratio of 1.6 p.p. which now stands at 77.9%.
The total assets of the company amounted to HRK 141.7bn, which represents an increase of 2.3% YoY. The increase could be attributed to a rise in cash, loans to customers and financial assets measured at fair value through other comprehensive income.
ZABA Performance (Q1 2019 vs Q1 2018)
To read more about ZABA click here.
In Q1 2019, the company recorded an increase in sales of 14.7%, an increase in EBITDA of 12.1% and a net income of HRK 57m (higher by HRK 51m YoY).
In Q1 2019, INA observed an increase in sales of 14.7% YoY, amounting to HRK 4.25bn. Meanwhile, operating revenues amounted to HRK 4.43bn, which represents an increase of 15%. Such an increase could be attributed to the continuation of favorable hydrocarbon prices and increased sales. It is also worth mentioning that lower Brent price by 6% had a negative effect of HRK 52m on crude oil and condensate sales revenues.
When looking at sales by segment, one can notice an 8% sales increase in Croatia and 23% in Bosnia & Hercegovina. Retail operations also recorded growth of 7%, partly due to the expansion of Montenegro network.
Operating Revenue (Q1 2019 vs Q1 2018) (HRK m)
The company notes that the Upstream benefited from the stable hydrocarbon prices and production levels. Maturity of INA fields and the natural decline in gas production was offset by the continuous efforts in oil production increase. This was followed by the increase in investments, the majority as before focused in Croatia, but also with a visible increase of spending in Egypt.
Refining operations are marked with a major turnaround in Rijeka refinery. This, together with the other investments projects, brought the CAPEX to HRK 618m, which represents an increase of 215% and is the biggest level in Q1 since 2010.
Going further down the P&L, the company observed an increase in EBITDA by HRK 58m (+12.1%), amounting to HRK 539m.
Net result from financial activities is negative in Q1 2019 (HRK -36m) compared to positive Q1 2018 (HRK +7m).
In Q1 2019, INA recorded a net income of HRK 57m, which is an increase by HRK 51m YoY. Such a high increase in net income could be attributed to lower tax paid in Q1 2019 of HRK 14m, compared to HRK 66m in Q1 2018.
Net Income & EBITDA (Q1 2019 vs Q1 2018) (HRK m)
In Q1 Kraš observed flat sales, decrease in EBITDA of 13.6% YoY and an increase in net income of 34%.
As Kraš published their Q1 2019 report, we are bringing you key takes from it. According to the report, the company observed flat sales of HRK 221.3m. Of that, sales in the foreign market accounted for HRK 112.1m which represents an increase of 10.1% YoY. The company notes that besides an increase in exports through affiliate companies in B&H, Macedonia and Serbia, they also recorded an increase in exports in the Western European and Central European market. On the other hand, sales on the domestic market accounted for HRK 112.2m, which represents a decrease of 6.1%.
Operating Revenues (Q1 2019 vs Q1 2018) (HRK m)
When observing operating expenses, the company observed an increase of 1.3%, amounting to HRK 217.1m (HRK +2.8m). Consequently, Kraš observed a decrease in EBITDA by HRK 2.8m (-13.6%), amounting to HRK 17.8m.
Going Further down the P&L, Kraš turned a net financial loss from Q1 of HRK -3m to a gain of HRK 1.04m in Q1 2019, which helped in the improvement of the bottom line.
In Q1 net income amounted to HRK 5.4m, which is an increase by HRK 1.4m (+34%) compared to the same period in the previous year.
EBITDA & Net Income (Q1 2019 vs Q1 2018) (HRK m)
At the current share price, dividend yield is 13%. Ex-dividend date is 10 June 2019.
Cinkara Celje published a convocation of the General Meeting of Shareholders in which they proposed a dividend of EUR 22.8m to be paid to their shareholders. The proposed dividend would translate to EUR 28.27 per share, which represents an increase of 6.6% compared to the previous year. At the current share price, the dividend yield is 13%, which would represent the highest yield since 2012.
Note that the ex-dividend date is 10 June, while the dividend should be paid on 12 June 2019.
In the graphs below, we are brining you a historical overview of the company’s dividend per share and dividend yield.
Dividend per Share (2013 – 2019) (EUR)
Dividend Yield (2013 – 2019) (%)*
*compared to the share price day before the dividend announcement