We’ve all, more or less, heard of the S&P500 index and it is representative of the US equity market. Today, we decided to present you with a breakdown of the mentioned index, along with the market perspective.
First of all, let’s start by highlighting the fact what the S&P500 actually is and this is short & sweet – composed of c.500 largest U.S. companies measured by the market capitalization of companies. This means the index contains all of the largest U.S. companies. Companies that are liquid, have a stable financial position and are (most of them) profitable companies. High-quality companies – in short.
We present you with a more detailed breakdown by sector for this index. This way, by buying an ETF that follows S&P 500 (this will be elaborated on soon), you actually know which sectors you are buying indirectly and what are you becoming an owner if owning the index as a whole.
S&P 500 composition by Sector
We can see that IT has by far the highest share within the index, currently standing at 27.9%. This significant share is primarily represented by shares like Apple, Microsoft, Google, Meta, etc… Share performance of these companies performed relatively worse compared to other sectors due to the nature of demand for those products/services. It is worth mentioning that the highest share in IT sectors are, as expected, Tech Hardware & Storage and Systems Software. With current rate hikes from FED, this sector could note the most significant impact on the index as a whole. Health Care follows with 14.3% in the index. The highest share within this sector as a whole is Pharmaceuticals, whose main representatives are UnitedHealth Group Incorporated and Johnson & Johnson. Since the start of 2019, UnitedHealth Group’s share price increased by as much as 104.6%, while Johnson & Johnson noted an increase of 27.6%, driven by solid growth in both top & bottom lines of companies. Also, Pfizer if worth mentioning with a weight slightly below 1% of the index. Next up, there are Consumer Discretionary and Financials with 11.5% and 10.6% of the index, respectively. These sectors are very cyclical and in the period when the recession is expected they could be hurt the most. Furthermore, Industrials make up 7.9% of the index. At the bottom of the list lies Utilities, Real Estate and Materials with 3%, 2.9% and 2.5%, respectively.
Furthermore, to put things into the context of the whole U.S. economy, the S&P500 market capitalization is around 70%-80% of the total U.S. market capitalization, which could be considered representative of the U.S. economy. The current capitalization of the index stands at USD 33.2 trillion (with a free-float market cap being only c.5% lower!), while the market cap to GDP ratio (known as the Warren Buffets indicator) stood at 257% in 2021. This means that the USA market capitalization was 157% greater than the GDP that the USD produced in 2021. The increasing trend in Buffet’s indicator can be clearly noticed since the 2000s (with exemptions in 2008 and 2011), meaning that market capitalization reported a more robust growth than the actual USD GDP did. Plainly stated, a lot of liquidity was poured into the equity markets. The same trend cannot be evidenced in regional markets. In Croatia, for example, besides the fact that this ratio stands at a much lower level in the last decade (average of c.37%), the trend where this ratio is going does also not correlate with the USA equity market. In Croatia Buffet’s ratio stand relatively still in the last 10 years, with a slightly decreasing trend with a CAGR of -2%. Also plainly stated, this means that in the observed period, market capitalization increase was lower than the GDP growth, which indicates that liquidity poured into the equity market could not be compared to the USA market.
Shares with the highest weight
To get a more specific view, we further decomposed the index by taking 13 shares with the highest share within the index. Each other index constituent contains <1% of index weighting. Accumulated, these companies contain 31% of total index weighting, leaving the other 69% for low-weighers.
We should emphasize that by buying an index you are already becoming an owner of a well-diversified portfolio, as can be seen from the chart above. This should be a goal of each rational and long-term investor and it can be achieved incredibly easily, just by owning an index.
So, how to „own“ an index and what is a concrete example of such?
If one would want a diversified portfolio, it could be achieved by owning a few shares from each sector for example, which could lead to tax & fee inefficiencies. This is a prime example of why investors should buy an index. But how? Besides obviously buying each index constituent and weighting it (?!), one can buy from his broker an ETF that replicates a chosen index. For simplicity, we will stick to just S&P500. There is Vanguard S&P500 ETF that replicates it and investors can indirectly become an owner of the 500 biggest U.S. companies by buying Vanguard S&P 500 UCITS ETF with Bloomberg ticker: VUAA LN Equity or ISIN: IE00BFMXXD54. This way, investors will bear just „classic“ broker fees like buying just a share on a chosen exchange.
There are numerous ETF’s that track S&P500, but this one is marginally better than it’s peer group due to several facts. First of all, it has a lower expense ratio than its peer comparison (0.07% compared to 0.095% for its peer). Second, and the more important reason is the fact that this ETF is considered “accumulating”, meaning the dividend payments are reinvested. First of all, this is tax efficient, as there will be no dividend payments, so no tax obligation occurs. Second of all, reinvesting income will amplify the capital gains in the long run, while in Croatia you are not obliged to pay any tax on capital gains if you hold an instrument for longer than 2 years. So there happens to be a synergy effect for tax efficiency, but the only important underlying factor is that the investor has a long-term investment span. The market Cap of said ETF currently stands at USD 4.81bn. Nevertheless, we note that the world of ETF’s is enormous and growing and this is just one example of ETF efficiency.
Performance of S&P500 since 1990
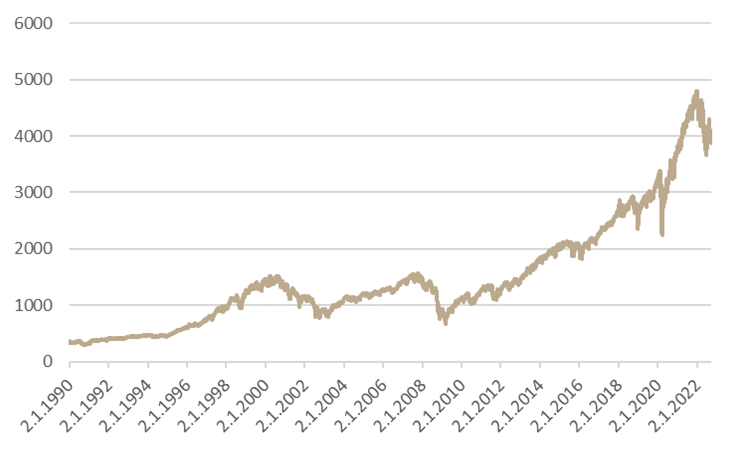
Overall, one can notice a solid performance of the said index, which is to be emphasized considering this is already a diversified financial product. In recent history, the Index suffered a strong decline of almost 50% during the financial crisis (to be known as the Great Recession in 2008), which was preceded by the 1982-2000 bull run. Afterward, there has been an almost 10-year bull run, which was reversed by a strong pandemic impact in 2020. Nevertheless, during the very next year, the index reached a new ATH with tough times ahead for the whole U.S. economy with rates hikes, inflation and a few others.
With this short history recap, we wanted to highlight one simple thing – the fact that the index is nothing but a reflection of the economy, including expectations. This fact alone should be enough to convince a rational long-term investor of the importance of products that replicate indices (let it be S&P500 or NASDAQ, DAX or any other) and that are available to the general public (meaning that any physical person can buy such an instrument).
On a YoY basis, the CPI increased by 12.3% on average in August, while the annual average stands at 7.8%. MoM inflation slightly increased by 0.1% with Food and non-alcoholic beverages contributing by 0.44 p.p., while the second most important category – Transport, actually decreased by 4.1% MoM, contributing by 0.60 p.p. to lower inflation, mostly due to lower prices of fuels for personal transport equipment.
The Croatian Bureau of Statistics has published the monthly report on the developments of the Croatian CPI (Consumer price indices) for August 2022. Looking at the MoM data first, the prices of goods and services for personal consumption, increased by 0.1% on average. On a YoY basis, the CPI increased by 12.3% on average, while on the annual average it grew by 7.8%. The 12.3% YoY growth in the CPI marks one of the largest increases ever recorded in Croatia and continues the trend of increasing inflation that started in the 2nd half of 2021. Nevertheless, we note that the MoM increase in CPI started to slacken a bit with just a slight monthly increase.
At the monthly level, the highest contribution to CPI growth was recorded in Food and non-alcoholic beverages (0.44 p.p.), while the second most important category – Transport, actually decreased by 4.1% MoM, contributing by 0.60 p.p. to lower inflation, mostly due to lower prices of fuels for personal transport equipment.
Taking a look at the largest contributors to the growth rate on the annual basis, Food and non-alcoholic beverages contributed 4.98 p.p., Transport 2.08 p.p. and Housing, water, electricity, gas and other fuels 1.77 p.p.
CPI (January 2013 – August 2022, %)
Furthermore, if we were to look at the biggest contributors to this increase on an annual level, it was recorded in the following segments: Food and non-alcoholic beverages, which increased by 19.2%, followed by Transport, which grew by 14.1%, Housing, water, electricity, gas and other fuels, which increased by 10.5% and Restaurants and hotels, which increased by 17.7% YoY.
We note that the previous month’s increase was profound as it recorded growth in inflation across all categories – leaving us with a high base to compare to. This is the reason why YoY inflation is particularly high, even though the MoM change in CPI is only 0.1%. On an MoM basis, the most important change that contributed to the overall change in the CPI was a change in Transport prices – it actually fell 4.1% on a monthly basis. This is the only category that decreased on a monthly basis. Nevertheless, The decrease in Transport prices was offset by growth in Food and non-alcoholic prices, which increased 1.5% MoM and mostly contributed to a 0.1% MoM growth in inflation.
On a YoY level, the increase in food and transport prices is particularly significant, and even though these were the main drivers of the inflation since it started spiking in late 2021, increasing by as much as 19.2% and 14.1%, respectively. Taking into account the gradual embargo of Russian oil imports into the EU during 2022, as well as the current war in Ukraine threatening food supply. We note this is the second month in row that inflations stands at 12.3% yearly increase and the fourth consequent month of the double-digit annual increase in prices. We can say we expect this trend to subside towards the year-end in order for us to have single-digit inflation growth in 2022.
At the same time, the increases across other categories mean that all industries are affected, something that has thus far proven not to be the case, at least not significantly. It should also be noted that the 2nd largest increase recorded (17.6% YoY), Restaurants and hotels can be attributed to the fact that the pandemic-related measures are completely gone.
CPI change by categories – July 2022 (YoY, %)
Finally, looking at the CPI by selected groups, Goods increased by 14.3% YoY, Services by 6.5%, Energy by 16.8%, and Food, beverages and tobacco by 16.7%. The total increase without energy was 11.3%, while without energy and food, it was 8%.
Pursuant to the Instructions for Indices, Liquidity Criteria, Price List and other Statistics a quarterly review of index calculation parameters of the SBITOP and SBITR was carried out and the index weighting factor of an issue of shares index was established. The Index composition changes as Salus is excluded from SBITOP and SBITOP TR composition.
As of today, new calculation parameters are valid with Salus being excluded from SBITOP and SBITOP TR.
In addition, LJSE announced candidates for inclusion into or exclusion from the SBITOP and SBITR indices. Currently, no candidate is on New Watch list for exclusion, while also no candidate is yet considered to be included.
| wdt_ID | Ticker | Index free float capitalisation (in EUR) | Weight (%) |
|---|---|---|---|
| 1 | KRKG | 725.850.178,03 | 29,55 |
| 2 | PETG | 487.809.302,84 | 19,86 |
| 3 | NLBR | 411.600.000,00 | 16,76 |
| 4 | ZVTG | 300.376.775,38 | 12,23 |
| 5 | POSR | 163.655.667,65 | 6,66 |
| 6 | LKPG | 126.084.000,00 | 5,13 |
| 7 | CICG | 115.540.711,00 | 4,70 |
| 8 | TLSG | 112.933.059,84 | 4,60 |
| 9 | UKIG | 12.571.335,61 | 0,51 |