Dovish central banks prolonged investors’ hunt for yield so spreads on peripherals and EM are decreasing again. Where’s the bottom for Bund and what are the consequences for CEE yields read in our short article.
Not that long ago, actually just few months ago, in October 2018 most of investors expected yields on upward trajectory as both FED and ECB were planning to tighten their monetary policy. There were even some popular bond investors and bankers who expected US 10Y to reach YTM of 4.0% or even 5.0% while most of the banks’ analysts were expecting Bund to end 2019 in 50-100bps range. However, that turned wrong when equity market in US collapsed in the last two months of 2019 dropping by almost 20% from its highs and forcing investors back to the safe havens such as US Treasuries and Bunds. Among other things, bear market forced Mr. Jerome Powell to ease his stance and completely abandon his intentions to bring reference rate closer to the neutral level, saying that we are very close to the neutral policy rate as it is. After the last monetary policy meeting, market sees it very unlikely that FED is going to lift its policy rate in this business cycle. Meanwhile, economic growth in Eurozone slowed down and inflation decelerated which was enough for dovish orientated central bank as ECB to postpone hike towards 2020 or even beyond while introducing another TLTRO. With these dovish messages from central bankers, equity market recovered with most of US indices being close to their all-time highs. Oil prices are not at their highs of 2018 although showing strong growth trend that could continue due to supply cuts and renowned optimism over world growth. Nevertheless, yields are relatively low again (Chart 1) and if any equity crash should emerge, that could send them even lower.
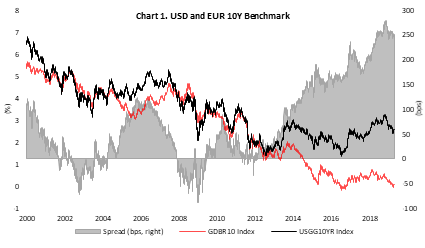
Source: Bloomberg, InterCapital
Talking about low yield environment, almost all CEE countries have seen them dropping significantly this year with spreads versus benchmarks being close to their all-time lows. On the Chart 2. submitted below it’s evident that since last December spreads on 2027 papers tightened significantly in all CEE (except in Romania, due to all the fuss around law changes). Croatian one tightened the most driven by S&P’s decision to lift its rating to investment grade. However, last week we have seen modest sell-off on Croatian papers, most likely reflecting some profit taking. High liquidity and central banks that are not expected to tighten their policy any time soon could continue pushing investors to search for yield in every corner of the world, so it shouldn’t be a surprise seeing Greek bonds trading at their lowest levels ever or Croatian 10Y way below 2%.
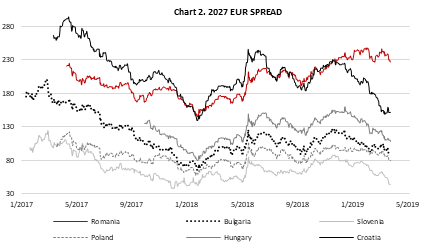
Source: Bloomberg, InterCapital
As the regional companies will soon start publishing their Q1 2019 results, we decided to bring you an overview of their release dates.
In the tables below, you can find the release dates of certain listed companies in Croatia, Slovenia
Of the observed companies, Luka Koper was the first company to publish Q1 2019 report on 10 April 2019 (Maritime throughput), which can be read about here. Other components of the SBITOP index will publish their reports in May.
Of the Croatian companies, Optima Telekom will be the first to publish the Q1 report on 24 April 2019. Note that most of the Croatian companies will be publishing their Q1 reports on 30 April 2019, while most of the Romanian companies will be publishing their Q1 reports on 15 May 2019.
We hope that the tables will help you keep track of the Q1 2019 release dates.
Croatia
| wdt_ID | Company name | Q1 2019 Report |
|---|---|---|
| 1 | Optima Telekom | 24/04/2019 |
| 2 | HT | 26/04/2019 |
| 3 | AD Plastik | 29/04/2019 |
| 4 | ERNT | 28/04/2019 |
| 5 | TNG | 29/04/2019 |
| 6 | Atlantic Group | 30/04/2019 |
| 7 | Arena Hospitality | 30/04/2019 |
| 8 | Atlantska Plovidba | 30/04/2019 |
| 9 | Dalekovod | 30/04/2019 |
| 10 | Končar | 30/04/2019 |
| 11 | Podravka | 30/04/2019 |
| 12 | Kraš | 30/04/2019 |
Slovenia
| wdt_ID | Company name | Q1 2019 Report |
|---|---|---|
| 1 | Luka Koper | 10/04/2019 |
| 2 | Telekom Slovenije | 09/05/2019 |
| 3 | Cinkarna Celje | 15/05/2019 |
| 4 | Pozavarovalnica Sava | 16/05/2019 |
| 5 | Zavarovalnica Triglav | 16/05/2019 |
| 6 | Petrol | 17/05/2019 |
| 7 | Intereuropa | 22/05/2019 |
| 8 | Krka | 23/05/2019 |
| 9 | NLB | 24/05/2019 |
| 10 | Unior | 31/05/2019 |
Romania
| wdt_ID | Company name | Q1 2019 Report |
|---|---|---|
| 1 | BRD | 03/05/2019 |
| 2 | OMV Petrom | 03/05/2019 |
| 3 | Banca Transilvania | 08/05/2019 |
| 4 | Alro | 14/05/2019 |
| 5 | BVB (Bursa) | 14/05/2019 |
| 6 | Conpet | 14/05/2019 |
| 7 | Nuclearelectrica | 14/05/2019 |
| 8 | Transgaz | 14/05/2019 |
| 9 | Digi Communications | 15/05/2019 |
| 10 | Electrica | 15/05/2019 |
| 11 | Fondul Proprietatea | 15/05/2019 |
| 12 | MedLife | 15/05/2019 |
| 13 | Purcari | 15/05/2019 |
| 14 | Romgaz | 15/05/2019 |
| 15 | Transelectrica | 15/05/2019 |
| 16 | Sphera Franchise Group | 15/05/2019 |
An eventual shut down in of
OMV Petrom recieved a sanction from the National Environmental Guard for carrying out at the Midia Processing Plant working point the activity of gas and petroleum transportation via pipelines without having a renewed environmental permit. The sanctions applied are a fine of RON 60,000 and measure to suspend the activity until the environmental permit is obtained.
An eventual shut down in of Midia Processing Plant would lead to a complete halt of the Black Sea production, currently at around 25,000 boe per day. Note that the production division provides more than 10% of Romania’s gas production.
It is important to mention that OMV Petrom challenged the fine and the respective measures in court. Until the court’s final decision, the measure is suspended.
The company states that they are working with the environmental authorities to obtain the renewal of the environmental permit which was up for renewal in December 2018. OMV Petrom applied for the renewal in October 2018, but they note that the process of the authorization renewal is complex and was prolonged more than expected due to additional requests by the competent environmental authority.
The Q1 report will be published on 15 May 2019.
As Romgaz published their preliminary information on Q1 2019 key operational indicators, we are bringing you its short overview. The main indicators can be seen in the table below. Note that the information provided may undergo changes and may differ from those in the Q1 2019 report, which will be published on 15 May 2019.
| wdt_ID | Main indicators | Q1 2018 | Q1 2019 | % change |
|---|---|---|---|---|
| 1 | Total hydrocarbon production (mil. boe) (1+2): | 8,81 | 9,26 | 5,20 |
| 2 | 1) Gross gas production | 8,80 | 9,23 | 4,90 |
| 3 | 2) Condensate production | 0,01 | 0,04 | 191,70 |
| 4 | Gross gas production (mil.cm) | 1.364,10 | 1.430,00 | 4,80 |
| 5 | Condensate production (tons) | 1,64 | 4,93 | 201,80 |
| 6 | Own gas delivered to the market (TWh) | 16,10 | 16,20 | 0,90 |
| 7 | Electricity production (GWh) | 287,30 | 170,90 | -40,50 |
| 8 | Invoiced UGS withdrawal services (mil.cm) | 1.098,20 | 884,80 | -19,40 |
| 9 | Invoiced UGS injection services (mil.cm) | 298,50 | 37,80 | -87,30 |