Some veteran traders were hoping for a relief rally on equities and risky assets following the US midterms, and this relief did come, albeit for different reasons. Sino-US détente coupled with the Chinese relief package and dovish comments from the big guns of central banking did provide relief. How are Croatian international bonds faring in this environment? Find out in this brief research piece.
Recent fixed income trading sessions have been marked by unusual bouts of volatility with geopolitical newsflow in the background. A couple of days ago, a missile that was allegedly launched from Ukraine as a part of anti-aircraft defense against Russian rockets crashed on the Eastern border of Poland. The knee-jerk reaction of the Polish political establishment, especially in the environment of the fog of war where the origins of the missile were dubious, was to initiate invoking article 4 of the NATO agreement, which would essentially kick off conflict escalation. The United States quickly initiated an investigation themselves, pinning the responsibility on the Ukrainian anti-aircraft defense and calling it an accident instead. This helped defuse the tensions and bring down the EURPLN exchange rate, which was in this environment used by CEE traders as a canary in a coal mine. As one CEE dealer put it: today EURPLN is the VIX of CEE bonds (it’s not quite accurate, but you got the feeling).
This incident was in our opinion given more attention than it deserved, although we are aware of the fact that the course of action might have been very different if the US administration chose the path of inaction instead. Anyways, two major narratives forming on the global Wall Street are focused on China supporting the housing sector and the increasing number of central bankers switching from pronounced hawks to in-the-closet doves. Speaking about the former (Chinese relief to the ailing property sector), the essence of the package is in extending the state-owned bank credit lines even further to help the troubled construction companies. It’s exactly what Japan did in the late 1980s and early 1990s and it worked in the sense that it calmed down the markets, but at the same time it put a lid on productivity growth in decades to come. Nevertheless, the news came from the commanding heights of the Chinese political establishment and it came at the same time as Joe Biden and Xi Jinping met in Indonesia and charted a course of détente in their bilateral relations. This was interpreted as quite a big deal because it defroze the communication lines between the two superpowers that were cut off after Pelosi’s visit to Taiwan (which now looks as nothing more than a trip used to collect political points ahead of the midterms). The relief package and the course of development on the political stage meant only one thing: China is loved by global asset managers all over again, and cash started to flow back to EM funds. Naturally, they bought other EMs as well, causing a contraction of the risk premium we see today as well.
In the backdrop of sino-US détente were the statements by global central bankers, the most prominent of them being Lael Brainard (vice chair of FED and likely Powell’s heir someday). The shadow FOMC chairwoman silently endorsed the 50bps hike in December, which was quickly misinterpreted as the new FED pivot. We remind you of Bernanke’s talk on the stock and flow effects of interest rate hikes, meaning that the FED can still make the monetary policy more restrictive by prolonging the time they keep the rates elevated. This can easily happen if the inflation deviates from the long term goal of 2.0% in the medium term. You are familiar with this adverse scenario – central bankers like to call it deanchoring of inflation expectations. Also, there is that 95bn USD per month QT that already drove the FED balance sheet to about 8.68bn USD (down from the peak by about 287bn USD). Janet Yellen would say that the paint is getting dry.
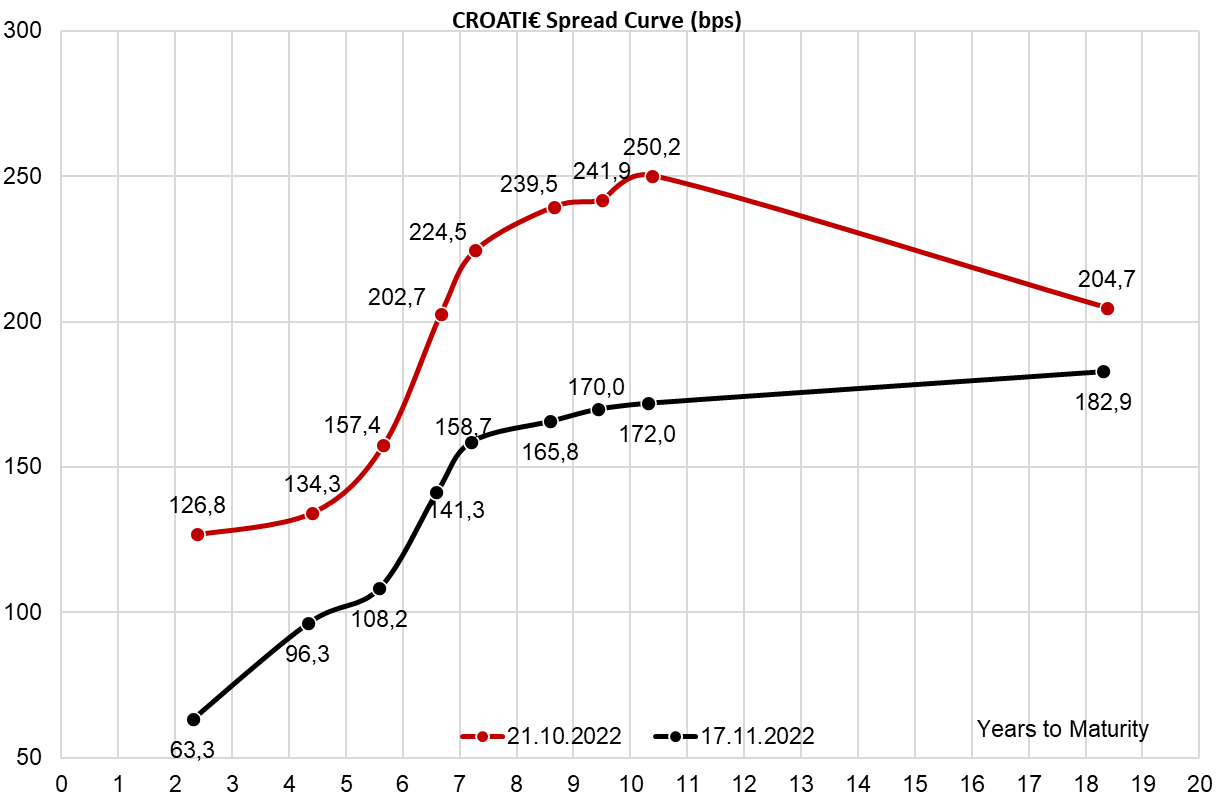
How are CROATI€ going through all of this CEE buying frenzy? What we have seen in the past weeks is that some Street dealers have obviously been opening up short positions on long CROATI€ at B+130bps (lucky ones) to B+150bps (ones who think they will get lucky). This is the only thing providing supply to the asset managers hungry for CROATI€ assets.
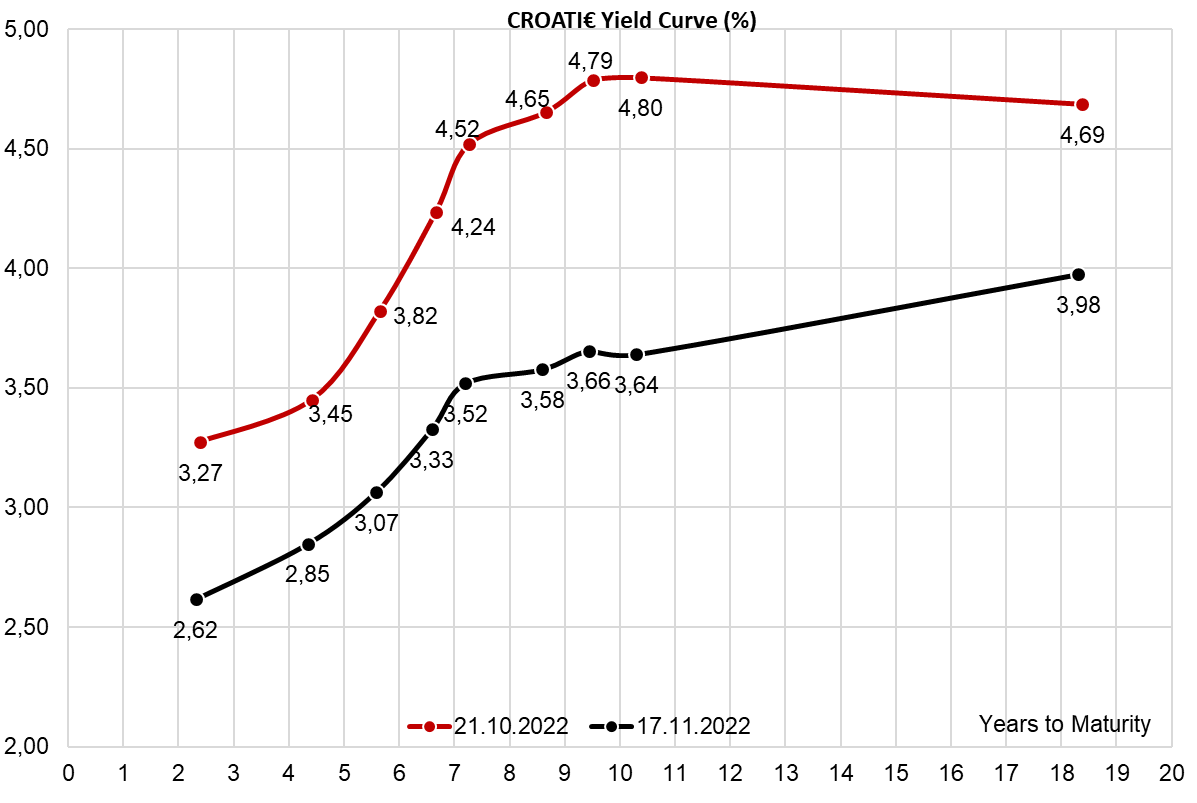
Where is the demand coming from? Part of it is certainly homegrown, however, we were informed that quite a lot of CEE insurances showed an appetite for CROATI€. The reason is that Croatian public funding needs are completely covered until early spring 2023, country is enjoying a stable inflow of EU funds (unlike Hungary) and has no issue with the banking sector (unlike Poland). This created a stable buying flow on the CROATI€. We would like to point out that although B+130bps looks really, really tight, one cannot exclude the possibility of the tight spread getting even tighter in an event of long-term benchmark yields going further down. So far, we have seen exactly this setup being formed on the global bond markets.
The largest contributors to the CPI growth on the annual level were Food and non-alcoholic beverages, which increased by 19.7%, followed by Restaurants and hotels, at 17.8%, Housing, water, electricity, ga and other fuels by 16.1% and Furnishings, household equipment and routine household maintenance, at 15.8%.
The Croatia Bureau of Statistics (DZS) has published the latest monthly report of the changes recorded by the Croatian Consumer price indices (CPI), for the month of October. Starting off with the annual level, the CPI in Croatia increased by 13.2% in October 2022, while on a monthly level, it increased by 1.3% on average. Meanwhile, on the annual average, the growth of the CPI amounted to 9.4%. The 13.2% increase in the CPI surpassed the last 2 months (12.3% and 12.8%) record, marking the highest CPI annual growth rate in the Croatian history, accelerating the trend of inflation growth that started in the 2nd half of 2021.
CPI (January 2013 – October 2022, %)
Looking at the largest contributors to this growth, on the annual level, the highest increase in CPI was recorded in the following segments: Food and non-alcoholic beverages, which grew by 19.7%. Next up, we have Restaurants and hotels, which grew by 17.8%, Housing, water, electricity, gas and other fuels by 16.1% and household equipment and routine household maintenance, which increased by 15.8%. Following them, we have Transport, which increased by 11.5%, Miscellaneous goods and services, which grew by 10.7%, Recreation and culture, with 8.4% growth, Clothing and footwear, with 6.6% and finally, alcoholic beverages and tobacco, with 4.4%.
This would mean that the trend we have witnessed for the last couple of months continues; not only does the overall inflation increase, which started with higher energy and food & beverage prices, but the pressure from higher inflation has been present on the market for so long, that it has spilled over to almost every industry. Now we have these “secondary” effects, with segments that aren’t directly affected by the main driver of the inflation growth (Russian invasion of Ukraine), increasing significantly. This mainly refers to categories such as Recreation and culture, and Clothing and footwear, but as mentioned, every category is affected.
Due to the composition and different weights in the CPI index measurements, these categories, even if equal, have a different effect on the CPI change. The highest weight in the calculation goes to Food and non-alcoholic beverages, which has 25.9% of the total, meaning that it contributed 5.11 p.p. to the CPI growth on the annual level, or more than one-third. Next up, we have Housing, water, electricity, gas and other fuels, which have 16.9% weight in the CPI calculation, meaning that is contributed 2.72 p.p. to the annual growth. Finally, we have Transport, with 14.7% of the weight, which has contributed 1.69 p.p. to the CPI growth. Other categories remained below 1 p.p. to the CPI growth contribution.
CPI change by categories – October 2022 (YoY, %)
Moving on to the monthly level, the CPI increased by 1.3% MoM on average. The story of this growth is somewhat different. The highest average increase in the CPI was recorded by Clothing and footwear, which increased by 6.9%, and contributed 0.4 p.p. to the CPI growth, however, this is due to new clothes and footwear collections. Also, we note that Clothing and footwear increased by over 20% in the previous months, so this month represents a lower growth in prices in this category. Other noteworthy categories include Housing, water, electricity, gas and other fuels, which increased by 2.8% (and contributed 0.47 p.p. to the growth), and Food and non-alcoholic beverages, which increased by 1% (+0.26 p.p. to overall growth). What is also interesting is the fact that Recreation and culture prices declined by 0.8% MoM, just slightly offsetting the growth in CPI.
What all of this data shows us is that prices in Croatia, like in the region, are still increasing, and moreover, they have spilled over to many different segments of the economy. The main drivers of the inflation growth, i.e. the war in Ukraine, and the subsequent sanctions on Russia are still present and not winding down, so further inflation growth could be expected.
In 9M 2022, BRD Group recorded an NII growth of 12.2% YoY, NFCI growth of 1.9%, a net banking income growth of 9.8%, and a net income to majority of RON 1.0bn, an increase of 10.4% YoY.
The net interest income for the period amounted to RON 1.72bn, an increase of 12.2% YoY. This growth was driven by an increase in interest revenues, building on the positive volume effect and higher rates (avg. ROBOR 3M at 5.63% in 9M 2022 vs. 1.59% in 9M 2021). This, however, was also affected by increasing funding costs related to corporate deposits, term deposits to individuals, and the usage of the Lombard facility within a tight liquidity environment.
Net fees and commissions income increased by 1.9% YoY to RON 575.3m, driven by the good performance of service fees, mainly due to the increase in revenue from card transactions and insurance fees. This compensated for the impact of lower commissions from e-banking given the migration of individual clients to the new free-of-charge mobile banking application. Other revenue categories increased by 13.4% YoY, mainly on the consistent increase in both trading and sales activities on all products. Because of the growth in these categories, net banking income increased by 9.8% YoY to RON 2.54bn.
Moving on, operating expenses increased by 6.5% YoY to RON 1.28bn. Of this, the biggest contribution came from personnel expenses and other operating expenses. Personnel expenses increased by 5.2% YoY to RON 648.9m, due to higher wages and other benefits. Other operating expenses increased by 9.9%, mainly due to higher expenses related to several external services and IT&C. Furthermore, the Contribution to Guarantee Scheme and Resolution Fund also increased, growing by 40% YoY to RON 69.2m.
The net cost of risk amounted to RON -37m (9M 2021: RON 41.7m), meaning that compared to last year when there was a release of provisions, BRD had to reserve a lot more this year. This was driven by charges on performing portfolios in response to macroeconomic trends. NPL ratio during the same period amounted to 2.6% (-0.6 p.p. YoY). The EBT for the period amounted to RON 1.23bn, an increase of 6.1% YoY, while the tax amounted to RON 212.6m, implying an effective tax rate of 17.3%, a decrease of 3.2 p.p. YoY. Following this, the net profit to majority amounted to RON 1.0bn during 9M 2022, an increase of 10.4% YoY.
BRD Group key financials (9M 2022 vs. 9M 2021, RONm)
Source: BRD Group, InterCapital Research
Moving on to the balance sheet, BRD Group’s total assets amounted to RON 71.2bn on 30 September 2022, which is an increase of 3.5% YoY. Of this, the largest growth was recorded in loans and advances to customers, which grew by 11.5% YoY to RON 36.2bn, and the loans and advances to credit institutions, which increased by 12.3% YoY to RON 7.2bn. On the other hand, total liabilities amounted to RON 64.9bn, an increase of 10.1% YoY. This was driven by an increase in deposits to other credit institutions, which increased by 130% to RON 7.65bn, and deposits from customers, which grew by 2.5% to RON 55.16bn. The increase in customer deposits was driven by retail (both individuals and small businesses) and non-retail (large corporates) with increases in term deposits and local currency resources.