As widely expected, on its yesterday’s monetary policy meeting, Fed decided to increase its reference rates by 25bps to 0.25% -0.50% range and it expects to continue hiking in each of the following meetings this year. In this brief article, we present yesterday’s decision, drivers, and what to expect further.
After slashing rates to zero exactly two years ago, Fed now decided it is time to start increasing them again and hiked rates by 25bps. In the statement, it is said that ongoing increases in the target range will be appropriate which took some of the investors with a bit of surprise. This means that Fed will most likely increase its rates on each of the remaining 6 meetings this year which will take the fed funds target range to between 1.75% and 2.0%. That was confirmed on the dot plot with one official projecting rates to increase above 3.0% already by the end of 2022. Median projections of the Fed Committee show that in 2023 we could see ‘only’ hikes at every other meeting and that would leave us at 2.75% to 3.0% at the end of 2023 which should be the peak of rates in this cycle according to the latest projections. On QT, Fed stated that “the Committee expects to begin reducing its holdings of Treasury securities and agency debt and mortgage-backed securities at a coming meeting”. Talking about new economic projections, it could be seen that the neutral rate was lowered by 10bps compared to December’s projections, to 2.4% meaning that rates should peak some 50bps above the newly projected neutral rate. As expected, inflation projections were lifted, and Fed now expects PCE inflation to average 4.3% in 2022 (compared to 2.6% in December’s forecast) and to decrease to 2.7% and 2.3% in 2023 and 2024, respectively. On the other hand, GDP projection for 2022 was lowered significantly compared to December to 2.8% while unemployment is expected to stay at 3.5%, reflecting full employment.
In the opening statement, Mr Powell stated that the economy is very strong and that the labor market is extremely tight with 1.7 job vacancies for every unemployed person. Furthermore, Fed’s governor said that they still expect solid growth in the following years and that the labor market should remain strong despite higher interest rates. In the Q&A session, Mr Powell was asked several times whether rate hikes could be decelerated in case of slower growth (higher unemployment) driven by higher rates, supply chain challenges, and higher prices i.e., will Fed choose the stability of prices rather than the economy in case of stagflation. Mr Powell said that price stability is the basis for a strong economy and that you can not have full employment without stable prices. We read this as Mr Powell was not ready to choose between his mandates but rather to fight one battle at a time. For now, Fed sees 40-year high inflation as their main hurdle while the economy would be dealt with if needed. The most important thing, what the markets said on the first hike after three years? After the statement was released, the Treasury curve went North, with 2y jumping to almost 2.0% while 10y increased to 2.24%. However, after the Q&A session, longer parts of the curve were mostly unchanged while 2y yield was increased by 7bps (1.93%) and being only 25bps below 10-year yield, as market expects economic slowdown which would force Fed to pause its hikes, like the scenario seen in December 2018. Equity markets were mostly higher with Fed’s decision being behind us coupled with some positive news on the Russia-Ukraine conflict. Looking further, we expect rates volatility to subside a bit, as the market now calculated both hikes and QT while more positive news from Ukraine could have a two-fold impact. Namely, risk-on could weigh on safe heaven assets while the end of the conflict could also decrease expectations on energy inflation.
Chart. Fed dot plot
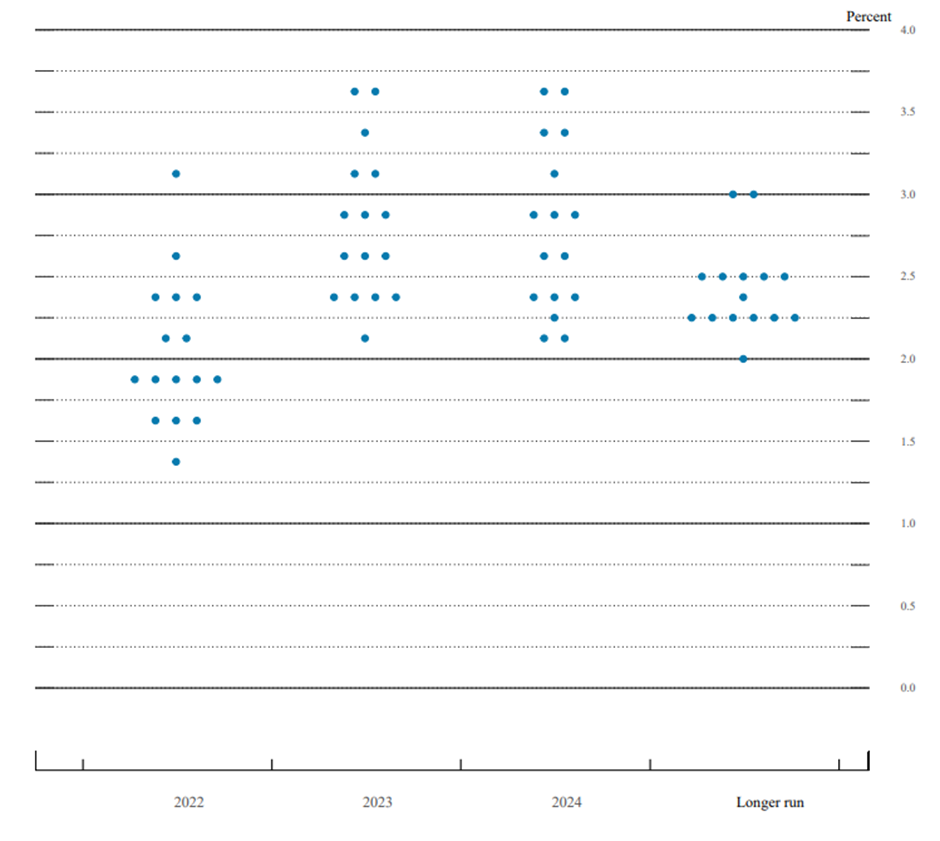
Source: Fed
Today, we present you with further DuPont decomposition of selected Croatian Blue Chips by looking into interest and tax burden and comparing it with their peers.
Since the beginning of the week, we looked at two components of 5-step DuPont decomposition of ROE: operating margin, financial leverage and asset turnover. You can read about it here. Today, we present you with the last two components of DuPont decomposition of the selected Croatian Blue Chips. Today we will look at interest burden and tax burden. These components highlight how much do tax and interest weigh down a company’s net profitability. These two components, along with discussed operating margin, are just an extension of the net profit margin calculation to give us detailed information about the impact of operating activity, interest and tax effect on the net profit margin of the company.
We should note that both interest and tax burden are calculated using P&L operating level and under, meaning they can more often be under the impact of “one-offs”.
Interest burden tells us the extent to how much the net financial result of the company together with profit from associates (20-50% shareholding) and investments (<20% share) impacts its profit. If a company pays more interest on its debt than what it receives as interest from its loans or profits from its investments into associates or joint venture, this ratio will fall below 1, meaning that net financial & investment result has impacted its profit negatively. It is calculated as EBT divided by EBIT.
Tax burden gives us a proportion of profits retained after tax. This indicates how much does tax impacts on company’s bottom line. It is calculated as a company’s bottom line, net profit, divided with EBT, pre-tax income. If a company has to pay in the observed period, this ratio will naturally fall below 1, dragging a company’s profitability downwards.
Interest burden – Croatian Blue Chips [FY 2021]
As can see from the graph above, the interest burden of all Croatian blue chips closely follow the industry mean, which should not come as a surprise. This is just a result of a similar capital structure within the same industry. Within the valuation context, this leads to a similar weighted average cost of capital (WACC), due to more similar capital and debt weights. Also, the reported situation can be partly explained due to companies operating in the same region and generating sales from a similar region. This leads to similar FX gains/losses, which are also affected by the company’s risk management and hedging strategy.
Nevertheless, Končar reported an interest burden of 1.23 as its EBT (HRK 238m) was higher than EBIT (HRK 194m). The reported interest burden higher of 1, by itself, indicates a positive net financial & investment result. Končar reported a net financial result of HRK 5m and net investment result of HRK 39m. The highest impact on net financial gain was achieved by interest revenues (amounting to HRK 6.8m) generated by the interest received on given deposits/loans which were higher than interest on loans paid of HRK 4m. Končar has a joint venture with Siemens, Končar-Power Transformers Ltd. (Končar – Energetski transformatori d.o.o., Zagreb) where it has a shareholding of 49%. This company was very profitable in this FY and Končar’s share of profit has amounted to HRK 35.4m.
Tax burden – Croatian Blue Chips [FY 2021]
As can see from the graph above, the tax burden of all Croatian blue chips closely follow the industry mean, which should also not come as a surprise. Tax burden indicates how much does tax impacts on company’s bottom line. If any of the blue chips reported significant deviation from the industry mean, it would probably be due to some “one-offs”, for example, a tax incentive. Valamar Riviera reported exactly the above-stated scenario. Valamar reported positive tax expense, effectively meaning it increase Valamar’s bottom line. Positive tax expense is a combination of this year’s tax expense, deferred tax assets and tax benefit, while tax benefit happened due to government incentives for Valamar’s investment in Isabella Resort, Family Life Bellevue Resort and Girandella Village.
Tomorrow we will elaborate the impact of all five decomposed components on Croatian Blue Chip’s Return on equity (ROE) and compare the whole picture given by DuPont within the industry contexts.
The growth of the Croatian CPI continues in 2022, reaching 6.3% YoY in February.
The Croatian Bureau of Statistics has released its monthly report on the movements of the CPI (Consumer price indices) for February 2022. In it, we can see that in February, the prices of goods and services for personal consumption increased by 6.3% YoY, on average. This marks the largest relative increase in CPI since the Global Financial Crisis in 2008, also achieving an all-time high since that period. This is also slightly above the 5.8% inflation rate experienced in the Eurozone in February.
CPI for the TTM (trailing 12 months) compared to the same period last year recorded an increase of 3.6%. The growth in CPI was driven by several parameters: Food and non-alcoholic beverages, which account for 26% of the total CPI, increased by 10% YoY. Transport, the 3rd largest component of the CPI, (at 14.7%), increased by 10.7%.
CPI (January 2013 – February 2022)
Breaking the CPI further, Housing, water, electricity, gas and other fuels (the 2nd largest component of the CPI at 16.9%), increased by 3.3% YoY. Furnishings, household equipment and routine household maintenance increased by 6.5% YoY. Alcoholic beverages and tobacco, which account for 5.1% of the CPI, increased by 6.4%. The only other category with an increase of over 5% was Restaurants and hotels, which grew by 6.2% YoY. Overall, most of the remaining categories had single-digit increases YoY, with Health and Education being the only ones below 1%, at 0.5% and 0.4%, respectively.
On an MoM basis, the CPI increased by 0.9%. The largest relative MoM increase was experienced by Clothing and footwear, at 3%, followed by Furnishings household equipment and routine household maintenance, at 1.9%.
CPI change by categories – February 2022 (%)
Looking over to the CPI by selected groups, Goods had an increase of 7.9%, Services increased by 1.7%, the total increase without energy was at 5.5%, and if we were to exclude food as well, the total without these two categories would stand at 3.2%.