Today, we decided to bring you a brief overview of the developments related to the Baltic Dry Index (BDI), as well as a selected group of related dry bulk commodities.
First of all, what is the Baltic Dry Index (BDI)? BDI is a shipping freight-cost index that is issued daily on the London-based Baltic Exchange. It is a composite of three dry cargo ship categories; Capesize (ships with the capacity of 170k dwt (Dry Weight in Tons), Panamax (82.5k dwt), and Supramax (58.3k dwt). This index is used around the world as a benchmark for the current dry bulk shipping demand/supply, costs, as well as the general health of the shipping market. Why is this index interesting? As a daily proxy of freight costs for various shipping routes around the world, it can be a good indicator of future economic activity. This is due to the fact that large quantities of cargo have to be needed for a company to order one of these ships; due to the high costs associated with these actions, companies (and by extension, countries), only book these ships when there is actual demand, be it for fossil fuels like coal, industrial metals like copper, steel, aluminum, or food commodities, like wheat/grains in general. As such, changes recorded by the index can show us the current supply/demand for shipping, and by extension, for commodities and as such, future economic activity.
Because of this reason, taking this index in combination with some of the most transported dry bulk commodities makes sense, as higher demand for commodities automatically means higher demand for shipping, and vice versa. One thing that should be noted with this index, however, is that it is quite volatile to price movements. This is due to the fact that the supply of ships is limited. let’s look at two examples. If there are 100 orders that need to be shipped but only 99 ships to fill them, the freight costs will go up. If there are 100 ships ready to fill orders but only 99 orders available, the freight costs will go down. If we also take into account that dry cargo ships are incredibly expensive and take at least 2 years to construct, this limits supply even more, and if we consider that projecting that far into the future the demand for anything, we can see why there will always be more demand for ships (in normal economic times, if we exclude shocks, pandemics, recessions, etc.) than there will available ships.
Currently, the BDI index is composed of 40% Capesize, 30% Panamax, and 30% Supramax categories (as of January 2018). As such, and due to other changes in the number of ships, type of ships, available tonnage, etc., the index cannot be taken as a 1:1 apple-to-apples comparison.
So having all of this in mind, how is the BDI index currently doing?
BDI Index (2010 – today, points)

Source: Bloomberg
As we can see from the graph, the index has fallen from 3,140 points in 2010, to app. 1,400 points today, a decrease of 55%. What’s even more profound is the change that can be seen before the pandemic, i.e., at the beginning of 2020. In fact, after dropping to 393 points during the pandemic, the index rebounded to the all-time high of 5.650 points in 2021. This happened due to a number of factors, but the main ones are the following: the reopening of the global economies in 2021, which significantly increased demand for commodities; and the constrained supply (as with the above examples with the number of ships/orders), which caused the costs of shipping to increase significantly. Since then, however, the situation did somewhat improve. In fact, since the beginning of 2022, the BDI index declined by 36%, while compared to the same period last year (mid of September 2022), it declined by 67%.
What can be taken away from this? A longer period of increased demand does not normally persist, except under special circumstances (like strong demand for alternative sources of certain fuels, as is the case in Europe and Russian gas right now), and as such, after a strong rebound in the economic activity, supply and demand did balance each other, and we started to see a decrease. At the same time, by mid-2021, the increases in prices and costs started to really fuel inflation, and this spiral is still present today. By the end of 2021, Fed decided to end its quantitative easing programs and start raising interest rates, to combat inflation. This whole situation continued developing, and the Russian invasion of Ukraine only added more fuel to the fire, especially when it comes to certain commodities like oil, gas, wheat, coal, and other precious/industrial metals. All of this had an impact on shipping demand, and as such, shipping costs, and the latest decrease and low point can be seen as a potential reduction in future economic activity (or even a recession), which if you listen to the news, is possible, especially in Europe.
But, taking the BDI index by itself would not tell the entire story, as the drop in demand for shipping could be “artificial”, as was the case during the pandemic, and not a real or voluntary reduction. To see if this is the case or not, we should look at commodity prices that drive the underlying demand for shipping. To better show this, we looked at some of the most transported dry bulk commodities in the world, i.e. coal, wheat, steel, copper, and aluminum.
Price changes of select commodities (2010 – today, %)
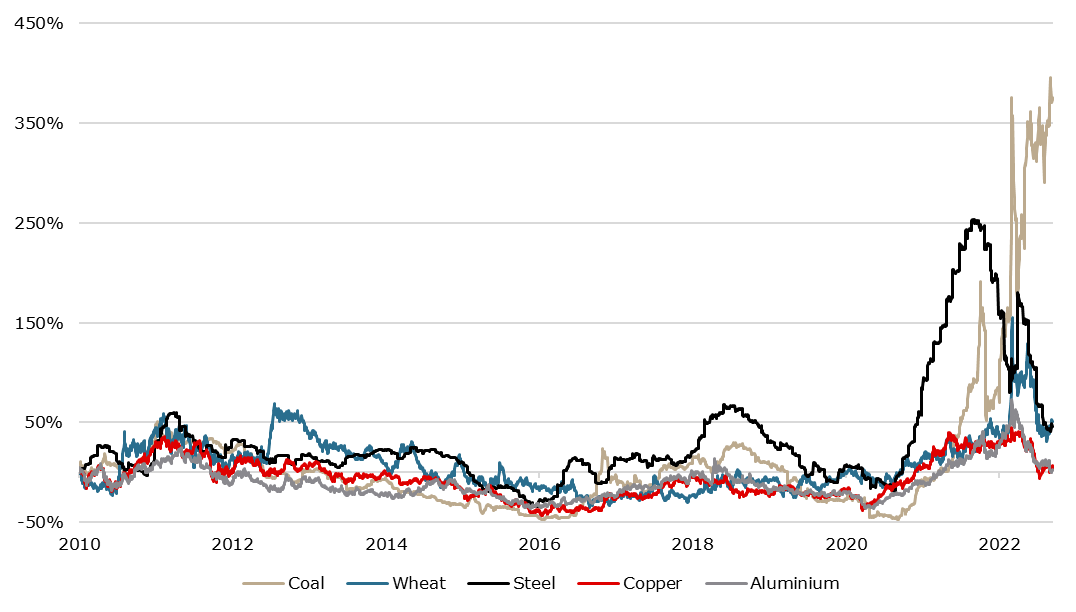
Source: Bloomberg
As we can see from the graph, during the 2010s, these commodities experienced cycles of growth and decline, and only in 2021 did they see massive growth. The reasons are the basic laws of economics, supply, and demand. This case, however, is quite peculiar. If the demand for these commodities drops, especially for a longer period of time, their prices will have to deflate, but not nearly as much as when the opposite happens. This is the effect we can see in 2020/2021. Prices dropped in 2020, but when the economies started reopening, the surge in prices was a lot larger and more significant. This is the reason why prices surged so much in 2021, at the end of the day, prices of these commodities are quite inelastic, and supply usually takes a while to catch up to demand. By the beginning of 2022, prices of most of these commodities somewhat stabilized, although at higher levels than the pre-pandemic. In fact, prices of copper are 27% higher compared to the beginning of 2020, prices of aluminium are 29% higher, steel is 37% more expensive, wheat is 51% more expensive, and coal is 549% more expensive. In fact, since the beginning of 2022, most of these commodities experienced decreases (aluminum -18%, copper -20%, steel -44%), while wheat experienced a modest increase (+9%), but coal again, increased significantly, by 159%.
What can all of this tell us? First of all, the deflation in the prices of industrial metals can be a pointer toward a future recession or at least an expectation of one. This is because if there is lower demand for these commodities, it means companies are ordering less, and thus producing less, which means less income… But it should be noted that this doesn’t have to mean that a recession will happen, but that the companies are hedging for this possibility.
At the same time, the increase in coal prices can be explained by the strong increase in demand, especially after the Russian invasion of Ukraine. The reason for this is twofold. Firstly, Europe stopped importing Russian coal, which means less supply and thus higher prices. At the same time, a replacement fuel has to be found for gas, at least in the short term. Considering that nuclear isn’t really a long-term option, especially in say, Germany, coal is starting to be used again, to replace the drop in energy production from the lack of Russian gas imports. Of course, LNG gas is being used as well, but it is already at its maximum, a maximum that is below what the EU countries imported from Russia before the war. As such, the difference has to be made somehow, and due to the lack of investment in nuclear energy for years and decades now, that difference is made up with coal… the exact opposite of the EU’s green transition plan.
In Q2 2022, revenue from internet access services amounted to HRK 1.38bn, an increase of 7.07% YoY.
HAKOM has recently published its ICT market data for Q2 2022 in Croatia. According to the report, total revenue from fixed public communication networks amounted to HRK 257m, a decrease of -5.7% YoY. Of that, revenue from retail amounted to HRK 231.2m, decreasing by -2.5% YoY, while wholesale revenue amounted to HRK 25.9m, a decrease of app. -27% YoY. Meanwhile, the total number of subscribers amounted to 1.2m, a decrease of -1.4%. Of that, HT currently holds the largest market share of 45%, remaining at the same level YoY, while other participants in the market hold the remaining 55%.
Total revenue from telephone services in mobile public communications in Q2 2022 declined to HRK 869m, a decrease of -2.66% YoY. Such a decrease came both on the back of decreases in retail revenue, which decreased by -0.72% and amounted to HRK 713.5m, and the wholesale revenue, which decreased by -10.69% and amounted to HRK 155.2m. In the retail segment, revenue from residential users, which constitutes 76% of the retail revenue, remained flat and amounted to HRK 534m. At the same time, revenue from business users decreased by -0.2% YoY and amounted to HRK 179m. Meanwhile, the total number of active mobile subscribers amounted to 4.507.074, a slight increase of 2.3% YoY.
Looking at the market share by subscribers, we can see that the situation remains mostly unchanged for the last couple of quarters, with HT maintaining the highest market share at 45% (a slight decrease from Q1), followed by A1, which currently holds a 35.3% market share. Lastly, we have Telemach, which holds 19.7% of the current mobile market share, an increase of 0.3 p.p. QoQ, and 0.1 p.p. YoY.
Mobile subscribers market share (Q4 2019 – Q2 2022, %)
Total revenue from internet access services amounted to HRK 1.4bn, an increase of 7.1% YoY. The increase came solely on the back of mobile internet revenue increase, which increased by 12.5% and amounted to HRK 920m. Fixed internet revenue decreased slightly by 2.3%. The total number of internet subscriptions also increased, growing by 4.4% and amounting to 5.994.673.
Total revenue from television services increased by 4.5% to HRK 220m, with the total number of pay-TV subscribers amounting to 878k, an increase of 0.4% YoY. IPTV users were up by 1% and amounted to 452k, while at the same time, satellite TV users decreased by -4.8% and amounted to 139k.
So, with all this data in mind, how did the two largest telecom companies in Croatia, Hrvatski Telekom and A1 perform during Q2 2022?
Hrvatski Telekom
The trends seen in the whole market are also quite reflective of the largest telecom company in Croatia. During the second quarter of 2022, HT recorded revenues of HRK 1.8bn, a decrease of 3% QoQ. Compared to Q1 2022, HT’s EBITDA margin decreased, while it increased its profit margin by 80bps. HT also remained a leading investor in digital infrastructure. Looking at H1 2022 organic revenues, (when adjusted for Optima Telekom’s contribution), increased slightly by 0.5%. Mobile service revenue was up 5.3% or HRK 63m, supported by strong postpaid and visitors and roaming, which offset the lower prepaid income. Fixed services revenues remained mostly flat, increasing by a slight 0.2% YoY.
Organic adjusted EBITDA after leases grew 4.3% YoY, representing a positive trend in the business model. OPEX decreased by HRK 21m, or 1% YoY. This decrease happened due to a lower material cost, which decreased by -2.9% YoY, employee benefits expenses (-1.6%), and write-down of assets (-24.7%). Finally, net profit amounted after minorities amounted to HRK 126m, an increase of 10% YoY.
A1
Meanwhile, the 2nd largest telecom company in the Croatian market, A1, recorded revenue of HRK 1.2bn, an increase of 3.7% QoQ. Services revenue grew by 5% and amounted to HRK 1bn. Service revenues and EBITDA reported growth in all markets. The total mobile subscriber base increased by as much as 4.3%, while internet@home subscribers also grew by 4.9% YoY. It should be noted that A1 Hrvatska is a part of A1 Telekom Austria, which besides these 2 countries has several other countries as a part of the Group.