Trade war was one of the main economic themes in 2018 but market expected there could be the deal as Mr Trump eased his rhetoric on China. However, as impulsive as he is, Mr Trump decided trade war should mark 2019 as well as he increased tariffs on existing Chinese goods and introduced tariffs on new goods. Few days later, China retaliated with tariffs on USD 60bn goods and is expected to reduce purchases of US agricultural goods and other products while US treasuries could be bought at a slower pace. In this short article we are analyzing the consequences of the tariffs on financial markets and CEE region.
Just as markets started to forget about trade war and turned bullish again, when S&P500 and other equity indices were reaching their all-time highs, Mr Trump once again decided there will not be the deal with China and that tariffs are to be increased/introduced. As we wrote in the summary, China’s officials retaliated and are planning to reduce purchases of US goods despite Mr Trump saying that “…there will be nobody left in China to do business with. Very bad for China, very good for USA…” and “…Therefore, China should not retaliate – will only get worse!”. In the meantime, White House Economic Advisor Larry Kudlow said that Mr Trump and Mr Xi are most likely to meet at the G-20 summit in Japan in June 2019. However, he also said that there aren’t definite plans when US and Chinese negotiators will meet again, leaving market in wonder whether fully blown trade war will continue crippling the financial markets. Knowing current POTUS and his rhetoric and bearing in mind that US presidential elections are coming closer we do not expect this story to end in June. Besides tariffs on Chinese goods, tariffs could be introduced on EU motor vehicles and the due is Saturday, May 18th although according to the media Mr Trump is to postpone these for 6 months. However, that is another story that’s going to keep investors’ off their toes this week.
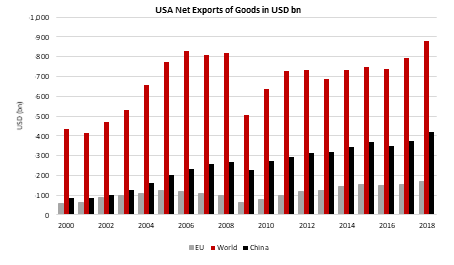
Source: US Census, InterCapital
As you may know, financial markets did not react on the news with much joy. Namely, equity prices all across the globe fell by several percentage points while volatility indices jumped close to their December highs. After the Chinese officials stated that they are introducing retaliatory measures S&P500 fell by 2.41% while US 10Y fell to 2.40%, few basis points above March’s lows. On the other side of the planet, EM assets were also hit as risk-off sentiment combined with big index ETFs do not spare one. However, Trump’s tweet “When the time is right, we will make a deal with China” was enough to drive modest recovery of risky assets as analysts expect Mr. Trump and his game theory politics could reverse once again for his great “victory”.
By Saturday, May 18th, Mr Trump has to decide on tariffs on EU motor vehicles and then the tariffs could be implemented in 15 days or in 180 days in case of further talks with EU officials so it is interesting to look at EU countries, especially CEE and which countries could suffer the most. On the chart submitted below you could see exports’ share of GDP among EU countries. First of all, one should bear in mind that EU as a whole runs CA surpluses and that exports made 49% of total GDP in 2018. Looking at the CEE one could see that Hungary, Slovenia and Czech Republic have their exports contributing by 80% to overall GDP. Furthermore, Bulgaria, Poland and Croatia are all above 50%. Although Czech Republic and Hungary are major exporters of parts for motor vehicles, all countries mentioned have their stake in the vehicle supply chain as well. Hence, without going into deeper analysis and breakdown of export countries, tariffs on EU goods and especially motor vehicles could weigh significantly on small and opened economies as CEE countries are. EM currencies such as PLN, CZK and HUF already depreciated versus euro in the last few weeks, but it seems there could be more in front of us in case USA decides to derail global trade further as it did last year.
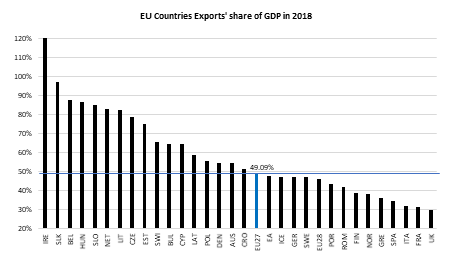
Source: Eurostat, InterCapital
In Q1, sales revenue decreased by 13.3%, EBITDA decreased by 55.1% and net income decreased by 64.5%.
As Cinkarna Celje published their Q1 2019 report, we are bringing you key takes from it. According to the report, the company observed a decrease in sales of 13.3% YoY, amounting to EUR 45.5m. The company notes that the recorded sales are 9% higher than the planned. Of that, EUR 40.6m (-11.3%) was made on the foreign market, while EUR 4.96m (-26.7%) was made on the domestic market. The company attributes the decrease in sales to the lower demand for the titanium dioxide pigment, which was reflected in a lower selling price. As a result of that, the company observed a poor performance further down the P&L.
Operating revenues in Q1, amounted to EUR 43.5m, which represents a decrease of 22.9%. The reason why operating revenues are lower than sales is that the company observed a negative change in the value of inventories of products and work in progress of EUR -2.68m.
Turning our attention to operating expenses, they observed a decrease of 5.5%, amounting to EUR 37.7m. The decrease could be attributed to the decline in material costs by EUR 2.7m (-9.1%). On the other hand, labor costs observed an increase of 6.8%, amounting to EUR 7.5m.
Going further down the P&L, EBITDA amounted to EUR 8.7m, which represents a decrease by EUR 10.7m (-55.1%). Such a high decrease could be attributed to the above-mentioned decrease in operating revenues.
In Q1, Cinkarna Celje observed a net income of EUR 4.6m, which represents a decrease of 64.5%.
Cinkarna Celje Performance (Q1 2019 vs Q1 2018)
When observing the investments made in Q1 2019, they amounted to EUR 1.5, which represents a decrease of 73% YoY and is 45% less than the quarter of the company’s 2019 investment plan. In Q1, the investments were focused mainly on a continuation of modernization, improving energy efficiency and ensuring the environmental acceptability of titanium dioxide pigment production.
In Q1, the company observed an increase in net operating income of 37.8% and an increase in net income of 41.1%. As of 30 April 2019, NAV amounts to RON 9.65bn (EUR 2.03bn), which translates into a NAV per share of RON 1.3527.
As Fondul Proprietatea (FP) published their Q1 2019 report, we are bringing you key takes from the report. The main contributor to the profit in Q1 was the net unrealized gain from equity investments at fair value through profit or loss amounting to RON 392.5m (+26.7% YoY), mainly generated by OMV Petrom SA, as a result of the positive evolution of this company’s share price in Q1. Note that OMV Petrom’s share price increased by 19.4% with the impact of RON 328.5m.
Gross dividend income amounted to RON 34.7m, which includes the dividend income earned from the Fund’s portfolio companies (collected in January 2019). This included the special dividends from Alro of RON 33.3m and Alcom of RON 1.3m. Note that in Q1 2018, Fondul Proprietatea did not record any gross dividend income.
As a result of both, the company observed an increase in net operating income 37.8% YoY, amounting to RON 429.3m.
When observing operating expenses, they amounted to RON 14.7m, which represents a decrease by RON 3.3m (-18.3%).
In Q1, the company recorded a net income of 414.4m, which represents an increase of 41.1%.
FP Performance (Q1 2019 vs Q1 2018) (RON m)
Turning our attention to the Fund’s NAV; as of 29 March 2019, the company reported a NAV of RON 10.17bn and a NAV per Share of RON 1.4190. In Q1 2019, the NAV per share had an overall increase of 0.7% YoY, mainly due to the positive share price evolution of the Fund’s listed holdings (OMV Petrom) and due to the tenth buyback programme carried out by the Fund.
Furthermore, as of 29 March 2019, the discount of the Fund’s share price to NAV was 35.5% which during Q1 ranged between 34.5% and 43.2%.
Overview of Fondul Proprietatea’s April 2019 NAV
Fondul Proprietatea also published their NAV as of 30 April 2019. According to the latest NAV report, Fondul reported a total NAV of RON 9.65bn (EUR 2.03bn), which translates into a NAV per share of RON 1.3527.
When comparing it to the same period last year, their NAV increased by 2%, while NAV per share increased by 5.8%. Meanwhile, when comparing MoM, Fondul’s NAV decreased by 5.1%, while their NAV per share decreased by 4.7%.
Fondul Share Price & NAV per Share (2016 – 15.5.2019)
Next, when observing the portfolio structure, it remains traditionally oriented towards the power, oil and gas sectors, whereby the two largest holdings, Hidroelectrica and OMV Petrom account for 63.43% of the total NAV.
Furthermore, when looking at the Fund’s portfolio structure, unlisted equities account traditionally for the largest share, with 73.4%.
Turning our attention towards the share’s price performance, as of 15 May, the share price amounted to RON 0.964, marking a 1.8% decrease YoY. The discount to NAV per share increased by 5.4 p.p. YoY and currently stands at 29.47%.
Fondul Price To NAV Discount (2016 – 15.5.2019) (%)
In Q1, the company recorded an increase in revenues of 15.6%, increase in EBITDA of 26.6% and an increase in net income of 16.3%.
Romgaz published their Q1 2019 Report. According to it, the company recorded an increase in revenue of 15.57%, amounting to RON 1.7bn.
The increase in revenue could be attributed to the rise of the income from natural gas sales by 13.3% both from Romgaz production and the ones purchased in order to be resold and from partnerships. The revenue observed still a high increase, despite the decrease in the income from electricity sales (16.86%) together with the decrease in the income from underground gas storage activity by 28.28% due to the decrease of the underground storage tariffs approved by ANRE applicable starting with 1 April 2018.
When observing the cost of commodities sold, it decreased by 9.65%, amounting to RON 77.3m due to the decrease in gas quantities purchased from import in order to be resold.
In Q1, the largest item of expenses was other expenses, which amounted to RON 501.7m, increasing by RON 144.6m (+40.5%). Such an increase could be attributed to the rise in petroleum royalty by RON 20.8m and the increase of windfall tax by RON 78.3m.
Going further down the P&L, EBITDA amounted to RON 894m, representing an increase of 26.6%. Note that depreciation and impairment increased by RON 106.9m, amounting to RON 263.2m (+68.41%). The increase could be attributed to net impairment of fixed assets amounting to RON 117.7m, as compared to the net gains of RON 9.2m from impairment in Q1 2018.
EBIT amounted to RON 630.8m, increasing by 14.7%.
In Q1, Romgaz observed an increase in net income of 16.3%, amounting to RON 541.8m.
Romgaz Performance (Q1 2019 vs Q1 2018) (RON m)
Turning our attention to investments in Q1, Romgaz Group scheduled investments in the amount of RON 330.2m and carried out investments of RON 188.4m approximately 43% less than scheduled. As compared to the same period in 2018, investments decreased by 56.7%.
In Q1, the company recorded an increase in revenue of 17.3%, a decrease in EBITDA of 61.2% and a net loss of RON -40.9m.
As Electrica published their Q1 2019 report, we are bringing you key takes from it. According to the report, the company observed an increase in revenues of 17.3%, amounting to RON 1.6bn. The increase mostly came from an increase on the supply segment of RON 228.9m (+22.2%), while the distribution segment recorded an increase of RON 27.6m (+4.5%). The increase on the supply segment can be attributed to the 6% retail sale price increase and the 6% increase in the supply of electricity on the retail market; the development of the natural gas supply activity had also a positive impact on the segment revenues.
Revenues (Q1 2019 vs Q1 2018) (RON m)
When observing the expense for electricity purchased, it increased by RON 254m, amounting to RON 996.4m (+34.2%). The increase came as a result of the rise in the electricity purchase prices in Q1 2019, compared with the same period of the previous year. The cost of the electricity purchased for supply and balancing increased by 24.8%, amounting to RON 767.6m, being the cumulative effect of the higher electricity purchase price and the increase in the quantity of electricity purchased. When observing the distribution segment, in Q1, the cost of the electricity purchased to cover network losses increased by 25.6%, amounting to RON 228.8m.
Going further down the P&L, EBITDA amounted to RON 74.1m, representing a decrease by RON 116m, which could mostly be attributed to a rise in operating expenses in Q1 2019.
Note that depreciation and amortization observed an increase of RON 11.3m (+10.2%), as a result of the reclassifications under IFRS 16 ‘Leases’, but also of a higher level of investments’ commissioning.
EBIT amounted to RON -47m, representing a decrease by RON 127.8m.
In Q1, as a result of the above-mentioned factors, Electrica recorded a net loss of RON 40.8m, representing a decrease by RON 100.1m.
EBITDA & Net Income (Q1 2019 vs Q1 2018) (RON m)
In Q1, the company recorded a decrease in revenues of 5.3%, decrease in EBIT of 46.7% and a decrease in net income of 44.3%.
As Transelectrica published their Q1 2019 report, we are bringing you key takes from it. According to the report, the company observed a decrease in revenue by RON 36m, amounting to RON 648.9m (-5.3% YoY). Of that, revenues from transmission services, which account for 44.7% of the total revenues, observed an increase of 6.7%, amounting to RON 290.2m. Since the electricity quantity delivered to consumers decreased 2.15% in Q1 2019, transmission service revenues registered increase amounting to RON 11.9m, determined by the growth of the average tariff for transmission services approved by ANRE.
Further, revenues from system services, which account for 26.7% of the total revenues, amounted to RON 173.3m (-14.2%). The decrease could be attributed to the decline in revenues from technological system services by RON 27.9m in Q1 2019, a sum determined by 2.15% diminished quantity of electricity delivered to consumers and by reduced ANRE approved tariff for such services.
Next, revenues on the balancing market, which account for 27% of the total revenues, amounted to RON 175m (-12.7%). The decrease could be mainly attributed to reduced negative imbalance registered for electricity suppliers on the balancing market, namely the imbalance between the net contractual position notified and the actual delivered power decreased.
When observing operating expenses, they amounted to RON 605.3m, remaining relatively flat.
Consequently, EBIT amounted to RON 43.5m, representing a decrease of 46.7%.
Moving further down the P&L, the company recorded a net financial loss of RON -4.1m, which is an increase of 11.1%. The increase in loss could be attributed to the development of the national currency’s exchange rate with the foreign currencies in which Transelectrica has contracted bank loans to finance its investments.
In Q1, net income amounted to RON 38m, representing a decrease of 44.3%.